
Probabilistic mental simulation is thought to play a key role in human reasoning, planning, and prediction, yet the demands of simulation in complex environments exceed realistic human capacity limits. A theory with growing evidence is that people simulate using simplified representations of the environment that abstract away from irrelevant details, but it is unclear how people determine these simplifications eficiently. Here, we present a “Just-in-Time” framework for simulation-based reasoning that demonstrates how such representations can be constructed online with minimal added computation. The model uses a tight interleaving of simulation, visual search, and representation modification, with the current simulation guiding where to look and visual search flagging objects that should be encoded for subsequent simulation. Despite only ever encoding a small subset of objects, the model makes high-utility predictions. We find strong empirical support for this account over alternative models in a grid-world planning task and a physical reasoning task across a range of behavioral measures. Together, these results offer a concrete algorithmic account of how people construct reduced representations to support eficient mental simulation.
確率的メンタルシミュレーションは、人間の推論、計画、予測において重要な役割を果たすと考えられていますが、複雑な環境におけるシミュレーションの要求は、人間の現実的な能力の限界を超えています。証拠が増えつつある説の一つとして、人間は環境の簡略化された表現を用いてシミュレーションを行うというものがありますが、人間がどのようにしてこれらの簡略化を効率的に決定するのかは明らかではありません。本稿では、シミュレーションに基づく推論のための「ジャストインタイム」フレームワークを提示し、最小限の追加計算でそのような表現をオンラインで構築する方法を示します。このモデルは、シミュレーション、視覚探索、表現の修正を緊密にインターリーブし、現在のシミュレーションが視線を誘導し、視覚探索が後続のシミュレーションのためにエンコードすべきオブジェクトをフラグ付けします。エンコードするオブジェクトのサブセットはごくわずかであるにもかかわらず、このモデルは高い効用予測を行います。グリッドワールドプランニング課題と物理的推論課題において、様々な行動尺度を用いて、この説明が他のモデルよりも強い経験的裏付けを得ました。これらの結果を合わせると、効率的なメンタルシミュレーションを支えるために人間がどのように簡略化された表現を構築するのかについての具体的なアルゴリズム的説明が得られます。
Human planning and reasoning rely on the ability to mentally simulate states of the world, such as imagining a free path through a cluttered kitchen, or evaluating the result of a billiards shot. However, real-world scenes contain a staggering amount of detail, and simulations of complex environments will necessarily contain far more detail than can be plausibly held in working memory (Alvarez & Cavanagh, 2004; Garner, 1953; Luck & Vogel, 2013; Miller, 1956; Vogel et al., 2001; Vul et al., 2009). How, then, are people able to fluently plan, predict, and pursue their goals?
人間の計画や推論は、散らかったキッチンを自由に通り抜けられる道を想像したり、ビリヤードのショットの結果を評価したりするなど、世界の状態を心の中でシミュレートする能力に依存しています。しかし、現実世界の光景には驚くほど多くの詳細が含まれており、複雑な環境のシミュレーションには必然的に、作業記憶に保持できる範囲をはるかに超える詳細が含まれます (Alvarez & Cavanagh, 2004; Garner, 1953; Luck & Vogel, 2013; Miller, 1956; Vogel et al., 2001; Vul et al., 2009)。では、人々はどのようにして目標をスムーズに計画し、予測し、追求することができるのでしょうか。
Recent work has focused on the idea that people construct reduced representations or construals of the environment that abstract away irrelevant details and contain only relevant features. Based on findings that people are selective in what they remember about environments (Kinney & Lombrozo, 2024; Shin & Gerstenberg, 2023), there have been attempts to formalize normative principles that describe what the mind chooses to represent. These theories often center around the idea that human cognition has limited capacity and must therefore make a rational trade off between the utility that representing an object has for improving our plans or decisions, and the cognitive costs of that representation (Arumugam et al., 2024; Gershman et al., 2015; Ho et al., 2022; Icard & Goodman, 2015; Lieder & Grifiths, 2020).
近年の研究は、人々が環境について、無関係な詳細を抽象化し、関連する特徴のみを含む、簡略化された表現や解釈を構築するという考え方に焦点を合わせています。人々が環境について記憶する内容を選択的であるという知見(Kinney & Lombrozo, 2024; Shin & Gerstenberg, 2023)に基づき、心が何を表現することを選択するかを記述する規範的原理を定式化する試みがなされてきました。これらの理論は、人間の認知能力には限界があるため、ある物体を表現することによる計画や意思決定の改善への効用と、その表現に伴う認知コストとの間で合理的なトレードオフを行わなければならないという考え方に焦点を合わせています(Arumugam et al., 2024; Gershman et al., 2015; Ho et al., 2022; Icard & Goodman, 2015; Lieder & Grifiths, 2020)。
However, while there has been extensive research on what people should represent, there has been little focus on how these construals are formed. A number of popular accounts of simulation-based reasoning implicitly assume that representation formation is a process that occurs prior to simulation or planning, and the utility of a construal is defined as how closely a simulation under that construal matches the simulation that would have been produced considering all objects. Yet this formulation leads to a paradoxical conclusion: exactly evaluating the utility of a construal requires considering a simulation using the full environment, making the search for an optimal construal more computationally taxing than simply including all objects in the first place (Russell & Wefald, 1991). While there have been proposals that avoid this paradox by, for example, learning to approximate utility based on prior experience (Lieder & Grifiths, 2017) orfinding the best resource-limited plan within a time budget (Gershman et al., 2015), these strategies do not easily generalize to novel tasks, or may waste computation on simulating construals that are subsequently discarded.
しかし、人々が何を表象すべきかについては広範な研究が行われてきたものの、これらの解釈がどのように形成されるかについてはほとんど焦点が当てられていない。シミュレーションに基づく推論に関する多くの一般的な説明は、表象形成はシミュレーションや計画に先立って行われるプロセスであると暗黙的に想定しており、解釈の有用性は、その解釈に基づくシミュレーションが、すべてのオブジェクトを考慮した場合に生成されるシミュレーションとどの程度一致するかとして定義される。しかし、この定式化は逆説的な結論を導く。つまり、解釈の有用性を正確に評価するには、完全な環境を用いたシミュレーションを考慮する必要があり、最適な解釈の探索は、最初からすべてのオブジェクトを単純に含めるよりも計算負荷が高くなるのである(Russell & Wefald, 1991)。このパラドックスを回避するために、例えば、過去の経験に基づいて効用を近似することを学習する (Lieder & Grifiths、2017) か、時間予算内でリソースが限られた最適な計画を見つける (Gershman et al.、2015) などの提案もありましたが、これらの戦略は新しいタスクに簡単には一般化できず、後で破棄される解釈をシミュレートするために計算を無駄にする可能性があります。
Here, we propose a formal model of simulation-based reasoning in which representations of the environment are incrementally constructed and modified. Our Just-in-Time (JIT) model uses a local visual scan to quickly flag high expected-utility
objects relevant for future steps of simulation. Details about the environment are added to a construal only when they are relevant to immediate next steps of the current simulation. In contrast to proposals that cast construals as the result of an explicit optimization (e.g. Ho et al., 2022; Icard & Goodman, 2015) — which require running many simulations up front to evaluate candidate construals — in our account, a construal is the result of iteratively adding relevant objects to memory throughout a single simulation. The
JIT model thus avoids the conceptual issues that arise from assuming that construals are built or evaluated prior to running simulations, while simultaneously finding construals that support accurate predictions or plans with minimal representational demands. In fact, perhaps surprisingly, the JIT model produces representations that on average contain fewer objects than models that assume precomputation, without a loss of performance in either planning or physical reasoning, and without requiring many simulations to evaluate the utility.
本稿では、環境の表現が段階的に構築・修正されるシミュレーションベース推論の形式モデルを提案する。ジャストインタイム(JIT)モデルは、局所的な視覚スキャンを用いて、将来のシミュレーションステップに関連する、期待効用の高いオブジェクトを迅速にフラグ付けする。環境に関する詳細は、現在のシミュレーションの次のステップに関連する場合にのみ、解釈に追加される。解釈を明示的な最適化の結果として提示する提案(例えば、Ho et al., 2022; Icard & Goodman, 2015)とは対照的に、候補となる解釈を評価するために事前に多くのシミュレーションを実行する必要がある。本稿では、解釈は単一のシミュレーション全体を通して関連オブジェクトをメモリに反復的に追加した結果である。したがって、JITモデルは、解釈がシミュレーション実行前に構築または評価されると仮定することから生じる概念的な問題を回避し、同時に、最小限の表現要求で正確な予測や計画をサポートする解釈を見つける。実際、おそらく驚くべきことですが、JIT モデルは、計画や物理的推論のパフォーマンスが低下することなく、ユーティリティを評価するために多くのシミュレーションを必要とせずに、事前計算を前提とするモデルよりも平均してオブジェクト数が少ない表現を生成します。
We test the JIT model as an account of human simulation-based reasoning in two domains: a grid-world planning task introduced in Ho et al. (2022), where participants navigate a grid-like maze, and a physical prediction task similar to Gerstenberg et al. (2018), where participants predict the trajectory of a ball as it falls through an array of obstacles. We focus specifically on the domains of planning and physical reasoning for three reasons. First, these are ecologically important domains in which people must function well in cluttered environments. Second, although planning and physical reasoning are often treated as distinct cognitive domains, prior research indicates that both capacities rely on mental simulation to select actions based on their expected outcomes (Battaglia
et al., 2013; Gerstenberg et al., 2021; Van Opheusden et al., 2023), suggesting commonalities in mental computation that our model can exploit. Finally, these domains nonetheless differ in a number of important ways — including both their objective dynamics and the brain areas supporting them (Fischer et al., 2016; Koechlin et al., 2000; Pramod et al., 2022; Tanji & Hoshi, 2008) — which allows us to test the generality of our framework. Altogether, our results provide evidence that people construct simplified representations of scenes by interleaving representation formation with simulation, producing effective and eficient construals to support planning and reasoning.
我々は、人間のシミュレーションに基づく推論を説明するJITモデルを、Ho et al. (2022) で導入されたグリッドワールドプランニング課題(参加者はグリッド状の迷路を進む)と、Gerstenberg et al. (2018) に類似した物理的予測課題(参加者は多数の障害物を通過しながらボールが落下する軌道を予測する)の2つの領域で検証する。我々は、プランニングと物理的推論の領域に特に焦点を当てるが、その理由は3つある。第一に、これらは雑然とした環境において人々がうまく機能しなければならない生態学的に重要な領域である。第二に、プランニングと物理的推論はしばしば異なる認知領域として扱われるが、先行研究では、どちらの能力も、期待される結果に基づいて行動を選択するために精神的シミュレーションに依存していることが示されており(Battaglia et al., 2013; Gerstenberg et al., 2021; Van Opheusden et al., 2023)、これは我々のモデルが活用できる精神的計算における共通点を示唆している。最後に、これらの領域は、客観的なダイナミクスとそれを支える脳領域の両方を含む、いくつかの重要な点で異なっています(Fischer et al., 2016; Koechlin et al., 2000; Pramod et al., 2022; Tanji & Hoshi, 2008)。これにより、私たちの枠組みの一般性を検証することができます。全体として、私たちの研究結果は、人々が表象形成とシミュレーションを交互に行うことで、場面の簡略化された表象を構築し、計画と推論を支える効果的かつ効率的な解釈を生み出していることを示す証拠となります。
We propose the Just-in-Time (JIT) model as a model of memory-eficient and time-eficient mental simulation that selectively represents a subset of the scene. Inspired by “just-in-time” principles—implemented across a variety of fields including computer science (Aycock, 2003) and logistics (Pisch, 2020)—that defer tasks until the results are needed, the JIT model defers representing objects until just before that representation is relevant for the current simulation. The framework we describe is general, requiring only three interacting components. First is a representational sketchpad that contains
object-centric information to support simulation. Next is a simulator that, given a current state s and optionally an action a, probabilistically forecasts possible future states: \(P(s^\prime|s,a)\). Finally we assume a perceptual lookahead module that uses the current state of the simulation to guide a local visual search to scan the scene for potential upcoming interactions and objects to include in the representation. The outcome of this iterative process is a construal of the scene: the final contents of the representational sketchpad including the set of objects whose effects are modeled in simulation: \(C \subseteq O\). We assume that memory is fallible, so that the longer a previously relevant object has not been used, the higher the probability it is forgotten. The construal arises from an iterative process of simulating, looking ahead, and encoding, each step of which we detail next.
我々は、シーンのサブセットを選択的に表現する、メモリ効率と時間効率に優れたメンタルシミュレーションのモデルとして、ジャストインタイム(JIT)モデルを提案する。コンピュータサイエンス(Aycock, 2003)やロジスティクス(Pisch, 2020)など、様々な分野で実装されている「ジャストインタイム」原理(結果が必要になるまでタスクを延期する)に着想を得たJITモデルは、オブジェクトの表現を、その表現が現在のシミュレーションに関連する直前まで延期する。我々が説明するフレームワークは汎用的で、相互作用するコンポーネントは3つだけである。1つ目は、シミュレーションをサポートするためのオブジェクト中心の情報を含む表現スケッチパッドである。2つ目は、現在の状態sとオプションでアクションaが与えられたときに、起こり得る将来の状態を確率的に予測するシミュレータである: \(P(s^\prime|s,a)\)。最後に、知覚的先読みモジュールを仮定します。このモジュールは、シミュレーションの現在の状態を用いて、シーンをスキャンし、表現に含める可能性のある今後のインタラクションやオブジェクトを探すための局所的な視覚探索を誘導します。この反復プロセスの結果は、シーンの解釈、すなわち、シミュレーションで効果がモデル化されるオブジェクトの集合を含む、表現スケッチパッドの最終的な内容です: \(C \subseteq O\)。記憶は誤りやすいと仮定し、以前関連していたオブジェクトが使用されなくなってから長い時間が経つほど、忘れ去られる可能性が高くなります。この解釈は、シミュレーション、先読み、エンコードという反復プロセスから生じます。各ステップについては、次に詳しく説明します。
Initializing the representation. The tasks that we consider require tracking or moving a single object through a mostly static environment. The representation is therefore initialized sparsely such that it only includes the tracked object, goal areas, and features common to all scenarios.
表現の初期化:本研究で検討するタスクは、ほぼ静的な環境において単一の物体を追跡または移動させることです。そのため、表現は、追跡対象物体、目標領域、およびすべてのシナリオに共通する特徴のみを含むように、スパースに初期化されます。
Simulate. At each step, the state is incremented by sampling from the simulator's probability distribution: \(s^\prime \sim p(s^\prime|s,a)\). The collection of states sampled so far produces a trajectory, which we label as \(τ = (s_1,s_2,...s_n)\). JIT produces predictions by sampling many such trajectories and aggregating their results.
シミュレーション 各ステップで、シミュレータの確率分布 \(s^\prime \sim p(s^\prime|s,a)\) からサンプリングすることで状態が増加します。これまでにサンプリングされた状態の集合から軌跡が生成され、これを \(τ = (s_1,s_2,...s_n)\) とラベル付けします。JIT では、このような軌跡を多数サンプリングし、その結果を集約することで予測を生成します。
Lookahead. After taking a simulation step, the model scans the visual scene for potential interactions that may be imminent, to identify objects that are not yet represented, but need to be. People's eyes naturally follow the simulated trajectory of objects (Callaway
et al., 2024; Gerstenberg et al., 2017; Huber & Krist, 2004), and by this tracing process we assume they will look at objects that are along this simulated path. This procedure draws
inspiration from accounts of visual attention that describe the environment as a kind of external memory (O'Regan, 1992): even if the simulated trajectory unknowingly violates physical constraints like interpenetration, the model can still check the trajectory against the visual scene to find an error and identify the offending object.
先読み。シミュレーションステップを実行した後、モデルは視覚シーンをスキャンして、差し迫っている可能性のある相互作用を探し、まだ表現されていないが、表現する必要があるオブジェクトを特定します。人の目は自然に、シミュレートされたオブジェクトの軌跡をたどります (Callaway
et al., 2024; Gerstenberg et al., 2017; Huber & Krist, 2004)。この追跡プロセスによって、人はこのシミュレートされた経路上にあるオブジェクトを見るものと想定されます。この手順は、環境を一種の外部記憶として説明する視覚的注意の説明 (O'Regan, 1992) からヒントを得ています。シミュレートされた軌跡が相互浸透などの物理的制約に無意識のうちに違反した場合でも、モデルは軌跡を視覚シーンと照合してエラーを見つけ、問題となっているオブジェクトを特定できます。
Encode. After lookahead, the representation is first updated with the new objects flagged by the lookahead module: \(C ← C \cup \{o:o \in ℓ(s)\}\). Then, the representation is culled,
probabilistically forgetting objects that have not been relevant for some time. Intuitively, objects that are encountered early in simulation often do not need to be revisited; and so continuing to encode an object that was previously represented but is not currently needed is wasteful. We therefore assume that objects are stochastically dropped from the representation with probability according to a power law (Anderson & Milson, 1989), controlled by a decay parameter \(γ\) (\(p\)(forget object \(o\)) \(\propto t^{−γ}\), where \(t\) is the number of steps since object o has been encoded).
エンコード。先読みの後、表現はまず先読みモジュールによってフラグが付けられた新しいオブジェクトで更新されます: \(C ← C \cup \{o:o \in ℓ(s)\}\)。次に、表現はカリングされ、しばらくの間関連性のないオブジェクトは確率的に忘れられます。直感的に言えば、シミュレーションの初期段階で遭遇するオブジェクトは、多くの場合再訪する必要がないため、以前に表現されたものの現在は必要のないオブジェクトをエンコードし続けるのは無駄です。したがって、オブジェクトは、減衰パラメータ \(γ\) (\(p\)(forget object \(o\)) \(\propto t^{−γ}\) によって制御されるべき乗法則 (Anderson & Milson, 1989) に従って確率的に表現から削除されると仮定します。ここで、\(t\) はオブジェクト o がエンコードされてからのステップ数です。
We test the JIT model in two domains to demonstrate its generality: planning and physical reasoning. The tasks we use share two key features. First, relevant interactions in both cases are always spatially local—i.e., objects require proximity to affect each other. This allows for eficient lookahead, which only needs to consider a limited set of prospective objects that are close to the simulation trajectory. Second, scenes are always perceptually available throughout the task, allowing objects to be accessed on demand by querying the external visual scene.
JITモデルの汎用性を示すため、計画と物理的推論という2つの領域でテストを行いました。これらのタスクには、2つの重要な特徴があります。まず、どちらの場合も、関連する相互作用は常に空間的に局所的です。つまり、オブジェクトが互いに影響を与えるには近接性が必要です。これにより、シミュレーションの軌跡に近い、限られた数のオブジェクトのみを考慮すれば、効率的な先読みが可能になります。次に、シーンはタスク全体を通して常に知覚的に利用可能であるため、外部の視覚シーンを照会することで、必要に応じてオブジェクトにアクセスできます。
We use the same task as Ho et al. (2022) for the planning domain (see Fig. 1, Left). An agent is placed in a grid world and must move their avatar to a green goal. However, there are walls blocking the movement of the avatar – there is always a cross in the middle of the world, and a number of other L-shaped walls that move between scenarios.
計画領域では、Ho et al. (2022) と同じタスクを使用します(図1左参照)。エージェントはグリッドワールドに配置され、アバターを緑のゴールまで移動させる必要があります。しかし、アバターの移動を遮る壁があります。ワールドの中央には常に十字があり、シナリオ間を移動するL字型の壁が複数あります。
Figure 1 The Just-in-Time model for constructing representations for planning and reasoning, and the two test domains. Left: a grid world task where the goal is to navigate an agent from start (blue circle) to goal (green square). Right: a physical prediction task, where the goal is to predict where a ball will land after falling through an array of obstacles. JIT incrementally updates a representation in between steps of simulation and perceptual lookahead. At each step of a model run, the state of the simulation is first incremented (simulate). Then, this state is used to guide a visual search of the scene to find potential collisions (lookahead), and any objects flagged by this search are then used included in the representation (encode), to drive the next steps of simulation. In the planning domain, simulation is implemented as a stochastic variant of the A⋆ search algorithm (Zhi-Xuan et al., 2020), and in the physics domain, simulation is implemented as a probabilistic physics simulation engine (Battaglia et al., 2013)
図1。計画と推論のための表現を構築するためのジャストインタイムモデルと、2つのテストドメイン。左:グリッドワールドタスク。目標は、エージェントをスタート(青い円)からゴール(緑の四角)まで誘導することです。右:物理予測タスク。目標は、障害物の配列を落下した後、ボールがどこに着地するかを予測することです。JITは、シミュレーションと知覚的先読みのステップの間に、表現を段階的に更新します。モデル実行の各ステップでは、まずシミュレーションの状態がインクリメントされます(シミュレート)。次に、この状態は、衝突の可能性を見つけるためのシーンの視覚探索をガイドするために使用され(先読み)、この探索によってフラグが付けられたオブジェクトは、表現に含められ(エンコード)、シミュレーションの次のステップを駆動するために使用されます。計画領域では、シミュレーションはA⋆探索アルゴリズムの確率的変種として実装され(Zhi-Xuan et al., 2020)、物理領域では、シミュレーションは確率的物理シミュレーションエンジンとして実装されます(Battaglia et al., 2013)。
Because the avatar and goal are task-relevant, and because the cross is always in the same location, representations are initialized with these three objects; however, all other walls must be explicitly added. Based on evidence that people plan stochastically insteadof deterministically maximizing utility when navigating (Zhu & Levinson, 2015), we implement simulation using a stochastic variant of an \(A^⋆\) planner (Zhi-Xuan et al., 2020). The \(A^⋆\) planner uses a Manhattan distance heuristic and a straight line tiebreak bias, such that when reconstructing a plan from the sequence of visited states, the planner will favor plans that travel in a straight line.
アバターとゴールはタスクに関連し、十字架は常に同じ場所にあるため、表現はこれら3つのオブジェクトで初期化されます。ただし、他のすべての壁は明示的に追加する必要があります。人々が移動する際に、決定論的に効用を最大化するのではなく、確率的に計画を立てるという証拠(Zhu & Levinson, 2015)に基づき、確率的な\(A^⋆\)プランナー(Zhi-Xuan et al., 2020)を用いたシミュレーションを実装します。\(A^⋆\)プランナーは、マンハッタン距離ヒューリスティックと直線タイブレークバイアスを使用しており、訪問した状態のシーケンスから計画を再構築する際に、プランナーは直線で移動する計画を優先します。
For the physical reasoning task, we consider a variant of the task introduced in Gerstenberg et al. (2018): a blue ball is dropped through a number of bumper objects and the goal is to predict where the ball will land on the green floor (see Fig. 1, Right). The model's representation of the scene initially contains only the ball and the floor; the bumpers must be added via JIT. We assume that simulation is probabilistic, including uncertainty about the initial position of the ball as well as noise in how collisions resolve (Allen et al., 2020; Smith & Vul, 2013; Wang et al., 2024).
物理的推論タスクについては、Gerstenberg et al. (2018) で導入されたタスクのバリエーションを検討します。青いボールを複数のバンパーオブジェクトを通過させて落下させ、ボールが緑の床のどこに着地するかを予測することが目標です(図1右参照)。モデルのシーン表現には、最初はボールと床のみが含まれており、バンパーはJIT経由で追加する必要があります。シミュレーションは確率的であり、ボールの初期位置に関する不確実性や衝突の解決方法に関するノイズが含まれると仮定します(Allen et al., 2020; Smith & Vul, 2013; Wang et al., 2024)。
We compare our JIT model to the Value Guided Construal (VGC) model proposed by Ho et al. (2022). VGC proposes that people should choose the construal that jointly optimizes the utility that can be obtained by planning using this construal, while minimizing the number of objects contained in that construal. This objective formalizes the parsimony of a representation: excluding an important object leads to infeasible plans or impossible physics, while representing irrelevant objects increases the complexity of representation without any gain in value.
我々は、JITモデルをHoら (2022) が提案した価値誘導型解釈 (VGC) モデルと比較する。VGCは、人々がその解釈を用いて計画することで得られる効用を共同で最適化し、かつその解釈に含まれるオブジェクトの数を最小化する解釈を選択すべきであると提唱する。この目的は、表現の簡素性を形式化する。重要なオブジェクトを除外することは、実行不可能な計画や不可能な物理特性につながる一方、無関係なオブジェクトを表現することは、価値の向上なしに表現の複雑さを増大させる。
While both models approach the construction of a construal from resource-rational principles, a key difference is in how JIT and VGC treat the utility of a construal.
JIT predicts that objects should be represented with a strength proportional to “need probability” (Anderson & Milson, 1989) – how likely that each object is to be used in simulation – while VGC directly optimizes the representational strength of each object to maximize the utility of a planner or simulator using that representation. Thus there are two key scenarios in which JIT and VGC will differ:
どちらのモデルもリソース合理主義の原理に基づいてコンストラクチュアルの構築にアプローチしますが、JITとVGCがコンストラクチュアルの効用をどのように扱うかという点が重要な違いです。
JITは、オブジェクトは「必要確率」(Anderson & Milson, 1989)(各オブジェクトがシミュレーションで使用される可能性)に比例した強度で表現されるべきだと予測します。一方、VGCは、各オブジェクトの表現強度を直接最適化し、その表現を使用するプランナーやシミュレータの効用を最大化します。したがって、JITとVGCが異なるシナリオは主に2つあります。
Ho et al. (2022) propose four variants of the VGC model, so to compare against JIT, we use their best fitting variant. This variant assumes that decision-makers modify their construal throughout the process of making their plans. Thus the best construal is the weighted average of the optimal construals at each point in the plan. In effect, this predicts that objects that are close to the start of a plan will have lower memory strengths as they are only relevant to the plan for short periods of time, whereas objects nearer to the goal will be better represented, as those objects are relevant throughout the plan.
Ho et al. (2022) はVGCモデルの4つのバリエーションを提案しているため、JITと比較するために、最も適合性の高いバリエーションを使用します。このバリエーションでは、意思決定者が計画策定プロセス全体を通して解釈を修正することを前提としています。したがって、最適な解釈とは、計画の各時点における最適な解釈の加重平均です。つまり、これは、計画の開始点に近いオブジェクトは計画との関連性が短いため記憶強度が低くなる一方、目標に近いオブジェクトは計画全体を通して関連性が高いため、記憶の強度が高くなることを予測しています。
For further details on the implementation of VGC, see Ho et al. (2022) and the Supplementary Materials Section S2.2.
VGCの実装の詳細については、Ho et al. (2022)および補足資料セクションS2.2を参照してください。
The primary experimental evidence for value-guided construals comes from measures of memory and attention in the grid-world navigation task of Ho et al. (2022). We re-analyze the behavioral data from all 9 experiments in that paper (Experiments 1A-I). In each experiment, the task consisted of two phases, a “planning phase” and an “execution phase.” In the “planning phase,” participants were first shown an image of a
grid-world — like the one shown in Figure 1 (left) — and asked to plan a path from start to goal. In the “execution phase,” obstacles were masked out and the participant was asked to execute their plan by moving the agent to the goal using a keyboard.
価値誘導型解釈の主な実験的証拠は、Ho et al. (2022) のグリッドワールドナビゲーションタスクにおける記憶と注意の測定から得られます。私たちは、その論文に掲載されている 9 つの実験すべて (実験 1A-I) の行動データを再分析します。各実験では、タスクは「計画フェーズ」と「実行フェーズ」の 2 つのフェーズで構成されていました。「計画フェーズ」では、参加者は最初に図 1 (左) に示すようなグリッドワールドの画像を見せられ、スタートからゴールまでの経路を計画するように求められました。「実行フェーズ」では、障害物はマスクされ、参加者はキーボードを使用してエージェントをゴールまで移動させることで計画を実行するように求められました。
We highlight results from three experiments in their paper (see the Extended Data Figure E4 for comparisons across all experiments): one that probed human memory (1C) in a way that is directly comparable to our physical prediction experiments, and two that probe attention (1D and 1E), as these experiments most directly test the dynamics of representation formation that we expect JIT to capture. In Experiment 1C, participants' memory for the location of objects was probed immediately after generating a plan in the execution phase. Participants were shown the original world except for one object replaced with two colored objects placed in different positions: one in the original position of the object and another shifted into a nearly position. They were then asked to identify which object was in the original, correct position and how confident they were on an eight-point scale. In Experiments 1D and 1E, which aimed to capture the dynamics of human attention, the objects were masked out during the planning stage and could only be revealed by hovering over them with a mouse. The dependent measure in these experiments was the proportion of participants who hovered their mouse over that object for any amount of time in the planning phase.
論文では、3 つの実験の結果に焦点を当てています (すべての実験の比較については、拡張データ図 E4 を参照)。1 つは、私たちの物理的予測実験と直接比較できる方法で人間の記憶を調べた実験 (1C)、もう 1 つは注意を調べた実験 (1D と 1E) です。これらの実験は、JIT が捉えると期待される表象形成のダイナミクスを最も直接的にテストするからです。実験 1C では、実行フェーズで計画を生成した直後に、参加者の物体の位置に関する記憶を調べました。参加者には、1 つの物体が異なる位置に配置された 2 つの色付き物体に置き換えられた元の世界が示されました。1 つは物体の元の位置にあり、もう 1 つはほぼ位置に移動されていました。次に、どの物体が元の正しい位置にあったかを特定し、8 段階スケールでどの程度確信しているかを尋ねられました。人間の注意のダイナミクスを捉えることを目的とした実験 1D と 1E では、計画段階では物体がマスクされ、マウスをその上にホバーさせることによってのみ現れるようにしました。これらの実験における従属指標は、計画段階で一定時間そのオブジェクトの上にマウスを置いた参加者の割合でした。
Results showing the fit of both the JIT model and the VGC model to human data from 1C-E are shown in Figures 2 and 3A. In experiment 1C, the JIT model has a higher correlation, lower RMSE, and higher log-likelihood than VGC (JIT: r = 0.95,
RMSE = 0.08, LL: − 1,763; VGC: r = 0.93, RMSE = 0.10, LL: − 1,809) while having one fewer free parameter. However, the predictions from the JIT model and the VGC model were highly correlated (r = 0.95). We also compare the probability of an object being included in a construal to the probability an object was hovered during the planning stage in Experiments 1D and 1E. Because there is no influence of memory on the probability of an object being hovered, we fix the JIT memory decay parameter γ to 0. Again, we find that our model explains human information seeking better than the
value-guided construal solution in both Experiment 1D (JIT: r = 0.88, RMSE = 0.18, LL = −8,093; VGC: r = 0.65, RMSE = 0.40, LL = −11,864) and Experiment 1E (JIT: r = 0.95, RMSE = 0.14, LL = −5,892; VGC: r = 0.74, RMSE=0.29, LL = −7,607).
JITモデルとVGCモデルの両方を1C-Eのヒトデータに適合させた結果を図2と3Aに示す。実験1Cでは、JITモデルはVGCよりも高い相関、低いRMSE、高い対数尤度を示した(JIT:r = 0.95、RMSE = 0.08、LL:-1,763、VGC:r = 0.93、RMSE = 0.10、LL:-1,809)。自由パラメータが1つ少ないにもかかわらず、JITモデルとVGCモデルの予測値は非常に相関していた(r = 0.95)。また、実験1Dと1Eでは、オブジェクトが構築に含まれる確率と、計画段階でオブジェクトがホバリングされる確率を比較した。物体がホバリングされる確率には記憶が影響しないため、JIT記憶減衰パラメータγを0に固定する。ここでも、実験1D(JIT:r = 0.88、RMSE = 0.18、LL = −8,093、VGC:r = 0.65、RMSE = 0.40、LL = −11,864)と実験1E(JIT:r = 0.95、RMSE = 0.14、LL = −5,892、VGC:r = 0.74、RMSE=0.29、LL = −7,607)の両方において、我々のモデルが価値誘導解釈ソリューションよりも人間の情報探索をよりよく説明していることがわかる。

Figure 2 Comparisons between human results, Just-in-Time model, and the Value-Guided Construal model in the process-tracing experiments (1D and 1E) of Ho et al., 2022. Participants were shown a blank maze in which only the center object was initially visible. They were instructed that moving the mouse over a masked object would reveal it. Their task was to plan a path from the start (blue circle) to the goal (highlighted green square), revealing as many objects as needed along the way. Heatmaps show the probability of an object being revealed by people, and the representational weight JIT and VGC assign to each object.
図2 Ho et al., 2022のプロセストレーシング実験(1Dおよび1E)における、人間の結果、ジャストインタイムモデル、および価値誘導型解釈モデルの比較。参加者には、最初は中央のオブジェクトのみが見える空白の迷路が示された。マウスをマスクされたオブジェクトの上に移動すると、そのオブジェクトが現れるという指示があった。参加者の課題は、スタート地点(青い円)からゴール(強調表示された緑の四角)までの経路を計画し、途中で必要な数のオブジェクトを明らかにすることであった。ヒートマップは、オブジェクトが人間によって明らかになる確率と、JITとVGCが各オブジェクトに割り当てる表現の重みを示している。
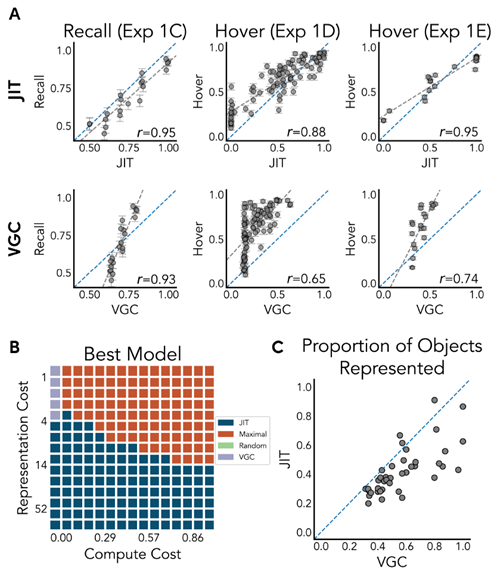
Figure 3 (A) Predictions from our JIT model (top row) compared to value-guided construal (bottom row) against human responses for three experiments in Ho et al. (2022). The blue line denotes the identity line, and the gray line denotes the line of best fit. (B) Quantitative model comparisons of compute and memory resource use for a set of procedurally generated grid worlds. We calculate a resource eficiency measure for four models (JIT compared to planning with the maximal representation, planning with a random representation, and planning with VGC) under a variety of cost assumptions. The net utility is inversely proportional to the sum of costs of representation (y-axis), computation (x-axis), and the length of the resulting plan. Heatmap colors visualize the most eficient model for each parameter regime. (C) Average proportion of objects represented by JIT and VGC in the same procedurally generated worlds.
図3 (A) Ho et al. (2022) の3つの実験における人間の反応に対するJITモデル(上段)と価値誘導解釈(下段)の予測値の比較。青い線は恒等線、灰色の線は最適線を示す。(B) 手続き型生成グリッドワールドのセットに対する計算リソースとメモリリソースの使用に関する定量的なモデル比較。さまざまなコストの仮定の下で、4つのモデル(最大表現による計画、ランダム表現による計画、VGCによる計画と比較したJIT)のリソース効率の尺度を計算する。正味の効用は、表現(y軸)、計算(x軸)、および結果として得られる計画の長さのコストの合計に反比例する。ヒートマップの色は、各パラメータレジームで最も効率的なモデルを視覚化する。(C) 同じ手続き型生成ワールド内でJITとVGCによって表現されるオブジェクトの平均割合。
Next, we conduct a series of simulation analyses to analyze the eficiency of representations that JIT finds in the planning task. We procedurally generate a set of 40 random grid worlds with a random number of objects, and analyze both the complexity of representations found by a set of models, and the computational overhead of constructing these representations. To do so, we compute an algorithmic utility V that, given an algorithm A, trades off the utility of planning, the complexity of representation, and the computational cost of planning, and then score JIT along with a series of baselines on this measure:
次に、JITが計画タスクにおいて発見する表現の効率性を分析するために、一連のシミュレーション分析を実施します。ランダムな数のオブジェクトを含む40個のランダムグリッドワールドのセットを手続き的に生成し、一連のモデルによって発見される表現の複雑さと、これらの表現を構築するための計算オーバーヘッドの両方を分析します。そのために、アルゴリズムAを与えられた場合に、計画の効用、表現の複雑さ、および計画の計算コストをトレードオフするアルゴリズム効用Vを計算し、この指標に基づいて一連のベースラインと共にJITを評価します。
\[
V (A) = \mathbb{E}[U(A)] − α · C_{\text{計算}}(A) − β · C_{\text{表現}}(A)
\]
Above, the utility of planning with an algorithm A is the negative length of the found plan, the cost of computation is the number of nodes expanded during search, and the cost of representation is the number of objects included in the construal. We compare JIT against three alternative models: a maximal baseline that always plans with all objects included, a random baseline that plans with a randomly selected construal, and a modified VGC model adapted to use heuristic search instead of policy iteration, so that the measure of computational cost can be consistent across all models. For each \(α\) and \(β\) within a wide range, we find the model with the highest utility, and visualize the results in Fig. 3B. We find JIT dominates in most regimes with two exceptions: VGC wins when there are no computational costs at all and only a low cost of representation (\(α\) is 0 with low \(β\)), and the maximal model performs best when computation is expensive and representation is cheap (high \(α\) and low \(β\)).
上記において、アルゴリズムAを用いた計画の効用は、発見された計画の負の長さ、計算コストは探索中に拡張されるノード数、表現コストは解釈に含まれるオブジェクトの数です。JITを3つの代替モデルと比較します。すべてのオブジェクトを常に含めて計画する最大ベースライン、ランダムに選択された解釈で計画するランダムベースライン、そして計算コストの測定値がすべてのモデル間で一貫しているように、ポリシー反復ではなくヒューリスティック探索を使用するように適応させた修正VGCモデルです。広い範囲の各\(α\)と\(β\)について、最も高い効用を持つモデルを見つけ、その結果を図3Bに視覚化します。 2 つの例外を除いて、ほとんどの状況で JIT が優勢であることがわかりました。計算コストがまったくなく、表現コストが低い場合 (\(α\) が 0 で \(β\) が低い場合)、VGC が勝ちます。また、計算コストが高く、表現コストが安い場合 (\(α\) が高く \(β\) が低い場合)、最大モデルのパフォーマンスが最も高くなります。
A key feature of JIT is that it computes a representation that supports the currently simulated trajectory, and not the representation necessary for planning the optimal trajectory. In many cases, an object might be deemed relevant by VGC because its existence changes an otherwise optimal path into a suboptimal one, but according to JIT, may be bypassed entirely during planning if the initial plan happened to take a different path. This leads our model to represent fewer objects than VGC on average, as shown in Fig. 3C (see also Extended Data Figure E5). So while VGC produces optimal construals under the assumption that all planning must be performed with that representation,
JIT only considers objects relevant to the singular current plan and will therefore often ignore objects in the optimal construal for VGC.
JIT の重要な特徴は、現在シミュレートされている軌道をサポートする表現を計算することであり、最適な軌道を計画するために必要な表現を計算するわけではないことです。多くの場合、オブジェクトの存在によって本来最適なパスが次善のものに変更されるため、VGC はオブジェクトを関連があると判断する可能性がありますが、JIT によれば、初期計画が別のパスを取った場合、計画中にそのオブジェクトを完全にバイパスできます。このため、図 3C に示すように、私たちのモデルは平均して VGC よりも少ないオブジェクトを表現します (拡張データ図 E5 も参照)。したがって、VGC はすべての計画をその表現で実行する必要があるという仮定の下で最適な解釈を生成しますが、JIT は現在単一の計画に関連するオブジェクトのみを考慮するため、VGC の最適な解釈ではオブジェクトが無視されることがよくあります。
While we have demonstrated that JIT can explain the representations that people form during planning, we have proposed this as a general cognitive framework people use for constructing representations for simulation-based reasoning. We therefore next show how JIT predicts human representations in the domain of physical prediction as a demonstration of the generality of this framework.
JITは人が計画中に形成する表象を説明できることを実証しましたが、これはシミュレーションに基づく推論のための表象を構築する際に人々が用いる一般的な認知枠組みとして提案したものです。そこで次に、この枠組みの一般性を示すために、JITが物理的予測の領域において人間の表象をどのように予測するかを示します。
We adapt the Plinko environments originally proposed in Gerstenberg et al. (2018) as our primary experimental domain. An example of the task is shown in Fig. 4A: given a static image of a scene with a ball suspended in mid-air, the goal is to predict where the red ball will land once gravity is turned on. We use memory probes to externalize the representations of objects that people are forming in these tasks; assuming that objects that are more deeply or frequently encoded during simulation are remembered better (Craik & Tulving, 1975).
我々は、Gerstenbergら (2018) が最初に提案したPlinko環境を主要な実験領域として採用する。課題の例を図4Aに示す。ボールが空中に浮かんでいる静止画像が与えられ、重力がかかった際に赤いボールがどこに着地するかを予測することが目標である。我々は、これらの課題において人々が形成している物体の表象を外在化するために記憶プローブを用いる。これは、シミュレーション中に深くまたは頻繁に符号化された物体はよりよく記憶されるという仮定に基づく(Craik & Tulving, 1975)。
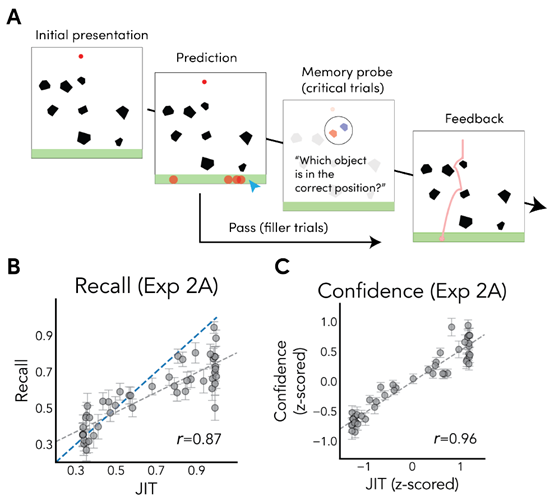
Figure 4 (A) Design of Experiment 2A. Participants saw a red ball above an array of obstacles and made predictions about where it would land. On a subset of trials, participants were then subsequently probed for their memory of a randomly chosen object's position. (B) Scatterplot of model predictions against human memory for objects. The blue dashed line denotes the identity line, and gray dashed lines denote the line of best fit. Error bars denote standard error. (C) Scatterplot of model predictions against confidence in recall (both z-scored).
図4 (A) 実験2Aの設計。参加者は障害物の上にある赤いボールを見て、それがどこに落ちるかを予測した。その後、一部の試行では、参加者はランダムに選ばれた物体の位置の記憶を調べた。(B) 物体に関する人間の記憶に対するモデル予測の散布図。青い破線は恒等直線を、灰色の破線は最もよく適合する直線を示す。エラーバーは標準誤差を示す。(C) 想起の信頼度に対するモデル予測の散布図(いずれもZスコア)。
In Experiment 2A, participants were presented with a Plinko world, and made predictions by clicking on the spots where they think the ball is likely to land. On critical trials (comprising of a third of all trials), participants were probed for their memory of randomly selected objects in the world: we showed participants the original world and a distractor world with the probed object shifted by a random translation, and asked them to identify which world was the correct one that they had just made predictions for. Judgments used a sliding scale sliding scale with extreme ends indicating surety in one of the two objects being in the original world, and the middle labeled as uncertain about the original location. We transformed these responses into ‘recall' measures indicating the proportion of participants having any evidence for the correct object, and ‘confidence' measures indicating the average position of the slider as a proportion between the middle and the end.
実験2Aでは、参加者にPlinkoの世界が提示され、ボールが落ちると思われるスポットをクリックして予測を行いました。重要な試行(全試行の3分の1を占める)では、参加者は世界内のランダムに選択された物体に関する記憶を調査されました。参加者には元の世界と、調査対象の物体がランダムに移動された妨害世界を示し、どちらの世界が予測した正しい世界であるかを識別してもらいました。判断には、両端が2つの物体のうち1つが元の世界にあることを確信していることを示し、中央は元の位置が不明であることを示すスライディングスケールを使用しました。これらの応答を、正しい物体について何らかの証拠を持っている参加者の割合を示す「想起」指標と、中央と端の間の割合としてスライダーの平均位置を示す「確信」指標に変換しました。
We next consider how well our model can predict the exhibited memory patterns, by correlating the computed representation traces of our model against the average recall for a given object in a given Plinko world. Our model has four total free parameters: three noise parameters that govern the behavior of the probabilistic simulator, and the decay parameter that governs how quickly object traces fade over time. We fit the noise parameters to a separate norming experiment (see Supplementary Section S1.3) and fit the decay parameter to maximize the correlation between model predictions and human recall.
次に、モデルによって計算された表現トレースと、特定のPlinkoワールドにおける特定のオブジェクトの平均想起率を相関させることで、モデルが提示された記憶パターンをどの程度正確に予測できるかを検証します。モデルには合計4つの自由パラメータがあります。確率シミュレータの挙動を制御する3つのノイズパラメータと、オブジェクトのトレースが時間の経過とともにどれだけ速く消えるかを制御する減衰パラメータです。ノイズパラメータは別の標準化実験(補足セクションS1.3を参照)に適合させ、減衰パラメータはモデル予測と人間の想起率の相関を最大化するように適合させます。
We find a strong correlation between the representation trace of our model and both recall (r = 0.87,RMSE = 0.18; Fig. 4B) and confidence (r = 0.96; Fig. 4C). This effect is not driven by individual variation among participants; we find that JIT is a good explanatory factor beyond accounting for individual differences in recall
(\(χ^2(1) = 310.33, p \approx 0\)). When fitting free parameters of the VGC model to human recall, we find that VGC has a slightly lower correlation to human data, and higher error: (recall: r = 0.82,RMSE = 0.28, confidence: r = 0.90). Similar to the planning memory experiment (1C), JIT and VGC predictions are highly correlated with each other (r = 0.93), but partial correlations show that JIT explains substantial variation on top of VGC
(rJIT|VGC = 0.49), while VGC barely improves on JIT: (rVGC|JIT = 0.08; see Fig. 5, Extended Fig. E8, and Supplementary Section S2.2 for further detail). Furthermore, additional control experiments suggest that participants' memory is not driven by low level visual processes such as passive fixation (Supplementary Section S1.1) or scene layout statistics (Supplementary Section S1.2).
モデルの表現トレースと再現率(r = 0.87、RMSE = 0.18、図4B)および信頼度(r = 0.96、図4C)の間には強い相関が見られました。この効果は参加者間の個人差によるものではなく、JITは再現率における個人差を考慮する上で優れた説明因子であることがわかりました。
(\(χ^2(1) = 310.33、p \approx 0\))。VGCモデルの自由パラメータを人間の再現率に当てはめると、VGCは人間のデータとの相関がわずかに低く、誤差が大きいことがわかりました(再現率:r = 0.82、RMSE = 0.28、信頼度:r = 0.90)。計画記憶実験(1C)と同様に、JITとVGCの予測値は互いに高い相関関係にある(r = 0.93)が、部分相関ではJITがVGCよりも大きな変動を説明する(rJIT|VGC = 0.49)のに対し、VGCはJITをわずかに上回る(rVGC|JIT = 0.08。詳細は図5、拡張図E8、補足セクションS2.2を参照)。さらに、追加の対照実験では、参加者の記憶は受動注視(補足セクションS1.1)やシーンレイアウト統計(補足セクションS1.2)などの低レベルの視覚プロセスによって駆動されていないことが示唆されている。
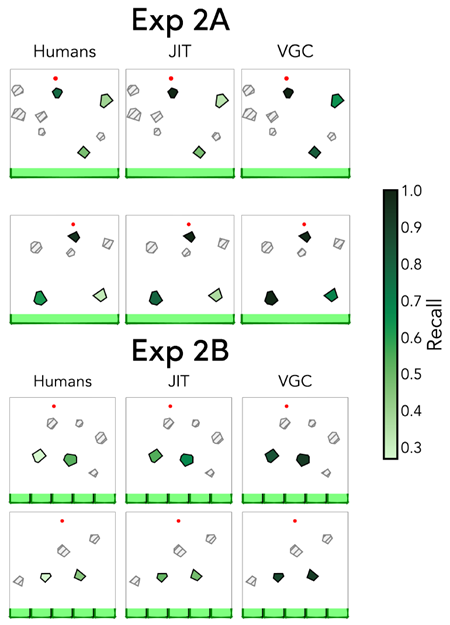
Figure 5 Selected worlds from Experiment 2A and 2B, where participants predicted the path that a red ball will take when let go, and were subsequently probed for memory of selected objects in the scene. We fit model parameters to maximize correlation with recall from experiment 2A, and transfer those parameters as-is to experiment 2B. Heatmaps show human recall for probed objects and predicted representations from both JIT and VGC; we did not probe memory for the gray hatched objects.
図5 実験2Aと2Bから選択された世界。参加者は赤いボールが放されたときに進む経路を予測し、その後、シーン内の選択された物体の記憶について調査された。実験2Aの想起との相関を最大化するようにモデルパラメータを適合させ、そのパラメータをそのまま実験2Bに転送した。ヒートマップは、調査された物体に対する人間の想起と、JITとVGCの両方から予測された表現を示している。灰色の網掛けの物体については記憶を調査しなかった。
Experiment 2A showed that the JIT model was able to explain patterns of human recall for a physical prediction task, but JIT's behavior was highly correlated with that of VGC. We therefore designed Experiment 2B to include stimuli that would explicitly dissociate the predictions of the two models.
実験2Aでは、JITモデルが物理的な予測課題における人間の想起パターンを説明できることが示されましたが、JITの行動はVGCの行動と高い相関を示しました。そこで、実験2Bでは、両モデルの予測を明確に分離する刺激を含めるように設計しました。
In this experiment, the procedure was the same as Experiment 2A except that in the prediction phase, the ground was segmented into five equally sized buckets, and participants selected which bucket they believed the ball would fall into. These buckets were used to make the outcomes of prediction more granular. We constructed critical worlds containing two types of objects where VGC and JIT made opposite predictions. “Counterfactually Relevant” objects make a large difference to the final prediction, but are contacted only half of the time under noisy simulation (Fig. 6A), and “Counterfactually Irrelevant” objects are contacted by the ball but made no difference to the bucket the ball would land in (Fig. 6B). VGC predicts that counterfactually irrelevant objects have low value and should not be represented at all, while predicting that counterfactually relevant objects should be represented more strongly. Conversely, JIT predicts that counterfactually irrelevant objects should be represented to a higher degree than relevant objects, as they show up more frequently in simulation.
この実験では、実験2Aと同じ手順で行われたが、予測フェーズでは地面を5つの等サイズのバケツに分割し、参加者はボールがどのバケツに落ちるかを予測した。これらのバケツは、予測結果をより細分化するために使用された。VGCとJITが正反対の予測を行う2種類のオブジェクトを含む臨界世界を構築した。「反事実的に関連」するオブジェクトは最終的な予測に大きな違いをもたらすが、ノイズのあるシミュレーションでは半分しか接触しない(図6A)。一方、「反事実的に無関係」なオブジェクトはボールが接触するが、ボールが落ちるバケツには影響を与えない(図6B)。VGCは、反事実的に無関係なオブジェクトは価値が低く、全く表現すべきではないと予測する一方、反事実的に関連のあるオブジェクトはより強く表現すべきだと予測する。一方、JITは、反事実的に無関係なオブジェクトはシミュレーションでより頻繁に出現するため、関連のあるオブジェクトよりも高い頻度で表現すべきだと予測する。
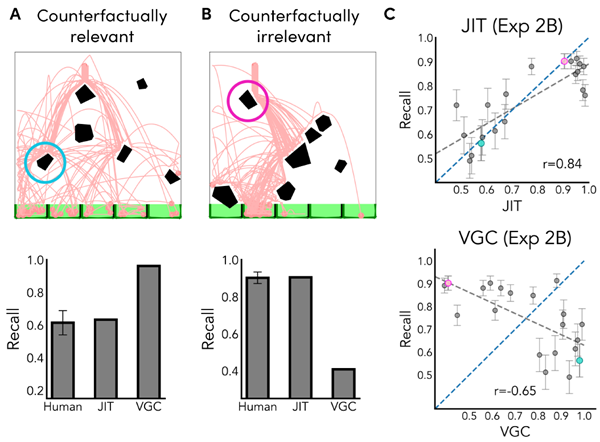
Figure 6 Experiment 2B trials with (A) counterfactually relevant and (B) counterfactually irrelevant objects. Light red lines indicate noisy simulations of the ball's path. Bar plots represent recall for humans vs. the JIT and VGC models for example objects of each type. (C) Correlations of model vs. human recall for JIT (top) and VGC (bottom). The blue line represents the identity line, while the grey line is the best fitting line. Error bars indicate standard error. Colored dots indicate data representing the objects shown in A & B. Like humans, the JIT model predicts high recall for the counterfactually irrelevant objects and moderate recall for the counterfactually relevant objects, while the VGC model makes the opposite predictions.
図6 実験2Bの(A)反事実的に関連するオブジェクトと(B)反事実的に無関係なオブジェクトを使用した試行。薄い赤の線は、ボールの軌道のノイズの多いシミュレーションを示しています。棒グラフは、各タイプのサンプルオブジェクトに対する、人間とJITモデルおよびVGCモデルの再現率を示しています。(C) JIT (上) とVGC (下) のモデルと人間の再現率の相関。青い線は恒等直線、灰色の線は最もよく合う直線を示しています。エラーバーは標準誤差を示しています。色付きの点は、AとBに示されているオブジェクトを表すデータを示しています。人間と同様に、JITモデルは反事実的に無関係なオブジェクトに対して高い再現率を予測し、反事実的に関連するオブジェクトに対しては中程度の再現率を予測しますが、VGCモデルは逆の予測を行います。
We reuse the exact same model parameters fit to Experiment 2A in order to compare the generality of each of the models. JIT's predictions align well with human memory (r = 0.84,RMSE = 0.11, see Fig. 6C), while VGC predicts the opposite pattern as people (r = −0.65,RMSE = 0.31).
各モデルの一般性を比較するため、実験2Aにフィッティングしたモデルパラメータを全く同じものを使用しました。JITの予測は人間の記憶とよく一致しました(r = 0.84、RMSE = 0.11、図6C参照)。一方、VGCは人間と逆のパターンを予測しました(r = −0.65、RMSE = 0.31)。
In this work, we have shown how eficient representations of the environment can be constructed without substantial computational overhead by interleaving encoding and simulation. We presented the Just-in-Time model, a general framework for
simulation-based reasoning and planning in visually grounded domains. Just-in-Time simulation effectively balances the trade-off between accuracy, computation, and memory complexity, and also empirically predicts traces of human memory better than competing resource rational models in both a grid-world planning and physical prediction task. These findings support the hypothesis that people incrementally build up a representation of the world as they simulate, rather than forming a fixed representation prior to simulation. While the intractability and memory burden of simulation in complex environments has been used to argue against the use of mental simulation in physical reasoning (Davis & Marcus, 2015; Ludwin-Peery et al., 2021), our results demonstrate how mental simulation can support physical reasoning and planning without incurring unreasonable memory demands.
本研究では、エンコーディングとシミュレーションをインターリーブすることで、大きな計算オーバーヘッドなしに環境の効率的な表現を構築できることを示しました。視覚的に根拠のある領域におけるシミュレーションに基づく推論と計画のための一般的な枠組みであるジャストインタイムモデルを提示しました。ジャストインタイムシミュレーションは、精度、計算量、メモリの複雑さの間のトレードオフを効果的にバランスさせ、グリッドワールドプランニングと物理的予測タスクの両方において、競合するリソース合理性モデルよりも人間の記憶の痕跡を経験的に正確に予測します。これらの知見は、シミュレーション前に固定された表現を形成するのではなく、シミュレーションを行う際に世界の表現を段階的に構築するという仮説を支持しています。複雑な環境におけるシミュレーションの扱いにくさと記憶負荷は、物理的推論におけるメンタルシミュレーションの使用に反対する議論として用いられてきましたが (Davis & Marcus, 2015; Ludwin-Peery et al., 2021)、私たちの結果は、メンタルシミュレーションが過度の記憶要求を引き起こすことなく物理的推論と計画をどのようにサポートできるかを示しています。
The Just-in-Time model is able to explain a variety of behavioral measures in two seemingly disparate domains, planning and simulation, with only a single parameter unrelated to the simulator (memory decay). The simplicity of the model, though, is in part enabled by properties of the tasks that make them less complex than most naturalistic scenarios. These simplifications include the fact that the displays in both tasks are static, they involve only a single target object, and they contain at most a handful of relevant objects—each of which is untrue of many real-world scenes (Battaglia et al., 2013; Davis & Marcus, 2015). Incorporating explicit capacity limits and more detailed mechanisms of memory decay may become important in explaining human simulation-based reasoning in cases where there are orders of magnitude more objects involved. The instructions also make clear what the relevant target object is from the outset, and people can fail to notice relevant moving objects if not explicitly cued (Bass et al., 2022). A more advanced
Just-in-Time approach would be needed to account for how people initialize their representations in arbitrary scenes and tasks, relying on pragmatics, visual attention, and prior experience with similar tasks.
ジャストインタイムモデルは、計画とシミュレーションという一見相反する二つの領域における多様な行動指標を、シミュレータとは無関係なパラメータ(記憶減衰)のみを用いて説明することができる。しかしながら、このモデルの単純さは、タスクの特性によって、ほとんどの自然現象よりも複雑性が低いという側面もある。これらの単純化には、両タスクの表示が静的であること、対象オブジェクトが一つだけであること、そして関連するオブジェクトの数がせいぜい一握りであることが含まれる。これらは多くの現実世界の場面では当てはまらない(Battaglia et al., 2013; Davis & Marcus, 2015)。明示的な容量制限と記憶減衰のより詳細なメカニズムを組み込むことは、対象オブジェクトの数が桁違いに多い場合の人間のシミュレーションに基づく推論を説明する上で重要になる可能性がある。また、指示は関連する対象オブジェクトが最初から明確に示しており、明示的に指示されなければ、人は関連する動くオブジェクトに気づかない可能性がある(Bass et al., 2022)。より高度な
人々が語用論、視覚的注意、そして類似のタスクにおける過去の経験に基づいて、任意のシーンやタスクにおいてどのように表現を初期化するかを説明するには、ジャストインタイムアプローチが必要となるでしょう。
Our current investigation has focused on the differences between
Just-in-Time representation building and pre-computed eficient representations in unfamiliar scenes. However, in many real world situations we do have prior knowledge that can help guide construals prior to any simulation. Human reasoning in familiar situations may be best explained by a combination of local lookahead and construction of construals through metacognitive deliberation or learned heuristics. For instance, when planning a path through your hometown, you might bring to mind an eficient set of landmarks on the way to your goal based on past experiences traveling to nearby locations, relying on preexisting knowledge that is not immediately available in the current tasks. Future work should study how the local lookahead of Just-in-Time simulation and the pre-computed representations of value-guided construals might be eficiently combined, allowing for process models of construal formation in a wider variety of situations.
私たちの現在の研究は、未知のシーンにおけるジャストインタイム表現構築と事前計算された効率的な表現の違いに焦点を当てています。しかし、多くの現実世界の状況では、シミュレーションの前に解釈を導くのに役立つ事前知識が存在します。馴染みのある状況における人間の推論は、局所的な先読みとメタ認知的熟考または学習されたヒューリスティックによる解釈の構築の組み合わせによって最もよく説明できるかもしれません。例えば、故郷での経路を計画する際、過去の近隣地域への旅行経験に基づいて、目的地までの効率的なランドマークを思い浮かべるかもしれません。これは、現在のタスクではすぐには利用できない既存の知識に頼ることになります。今後の研究では、ジャストインタイムシミュレーションの局所的な先読みと価値誘導解釈の事前計算された表現をどのように効率的に組み合わせるかを研究し、より多様な状況における解釈形成のプロセスモデルを可能にする必要があります。
Nonetheless, our results offer a solution for designing agents that must plan and interact with complex, real-world environments. Modern robotics planning algorithms often face computational challenges when operating in cluttered environments with irrelevant objects (Silver et al., 2021). Similar deferred approaches have been applied to robotics problems such as motion planning (Hauser, 2015), but have primarily been analyzed through the lens of reducing computational cost rather than representational complexity. An incremental approach to constructing representations as an agent plans provides a method for producing simplified construals and therefore reducing the branching factor of planning.
それでもなお、我々の研究結果は、複雑な現実世界の環境を計画し、相互作用しなければならないエージェントを設計するための解決策を提示する。現代のロボット工学における計画アルゴリズムは、無関係な物体が散乱した環境で動作する際に、しばしば計算上の課題に直面する(Silver et al., 2021)。同様の遅延アプローチは、動作計画(Hauser, 2015)などのロボット工学の問題にも適用されてきたが、主に表現の複雑さではなく計算コストの削減という観点から分析されてきた。エージェントが計画する際に表現を構築する漸進的なアプローチは、簡素化された解釈を生成する方法を提供し、それによって計画の分岐要因を削減する。
We have presented Just-in-Time simulation primarily as a model of cognition in visually-grounded and visually-persistent domains, as these domains allow for cheap and effective implementations of lookahead through visual foveation. However, the
Just-in-Time approach is not fundamentally limited to settings involving explicit perceptual input. For instance, local goal-directed search may equally apply to visual imagination, which could explain why people conceptualize only a subset of scene features (Bigelow
et al., 2023). Incremental representation building from local search may also help explain human planning and reasoning in more abstract cognitive domains, such as sub-goaling and subproblem construction in logical reasoning (Cheyette et al., 2025; Olieslagers et al., 2024) and foraging-like search patterns in semantic retrieval (Hills et al., 2012; Smith et al., 2013). Just-in-Time representation building may therefore constitute a general strategy by which minds manage complexity and thus become increasingly relevant as we seek to scale models of natural and artificial intelligence to more naturalistic environments.
我々はジャストインタイムシミュレーションを、主に視覚的に根拠づけられた領域と視覚的に持続的な領域における認知モデルとして提示してきた。これらの領域では、視覚中心窩形成による先読みを安価かつ効果的に実装できるからである。しかし、ジャストインタイムアプローチは、明示的な知覚入力を伴う状況に根本的に限定されるわけではない。例えば、局所的な目標指向的探索は視覚的想像力にも同様に当てはまる可能性があり、これは人々が情景特徴のサブセットのみを概念化する理由を説明できる可能性がある(Bigelow
et al., 2023)。局所探索からの漸進的な表現構築は、論理的推論におけるサブゴール設定やサブ問題構築(Cheyette et al., 2025; Olieslagers et al., 2024)、意味検索におけるフォージングのような探索パターン(Hills et al., 2012; Smith et al., 2013)など、より抽象的な認知領域における人間の計画と推論を説明するのに役立つ可能性がある。したがって、ジャストインタイムの表現構築は、心が複雑さを管理するための一般的な戦略を構成する可能性があり、したがって、自然および人工知能のモデルをより自然な環境に拡張しようとするときにますます重要になります。
The JIT model incrementally builds up a representation consisting of relevant objects in the environment during simulation. The output of this model is a construal, containing all objects represented in working memory at the end of simulation. For all analyses, we use the average construal as computed using Monte Carlo simulation, which describes the probability an object is present in working memory at the end of simulation.
JITモデルは、シミュレーション中に環境内の関連オブジェクトからなる表現を段階的に構築します。このモデルの出力は、シミュレーション終了時にワーキングメモリに表現されているすべてのオブジェクトを含むコンストラクチュアルです。すべての解析において、モンテカルロシミュレーションを用いて算出された平均コンストラクチュアルを使用します。これは、シミュレーション終了時にオブジェクトがワーキングメモリに存在する確率を表します。
In the rest of this section we provide full details on how the model is implemented for each of the two domains. To adapt the model for each individual domain, we must specify the state space \(S\); the dynamics of the environment, encoded in a transition function \(f\); and how the agent looks for potential collisions, expressed in a lookahead query \(ℓ(s)\) that takes in the current simulation state and returns any possible colliding objects.
このセクションの残りの部分では、2つのドメインそれぞれにおけるモデルの実装方法について詳しく説明します。モデルを各ドメインに適応させるには、状態空間\(S\)、遷移関数\(f\)で表現される環境のダイナミクス、そしてエージェントが衝突の可能性をどのように検知するか(現在のシミュレーション状態を取り込み、衝突の可能性のあるオブジェクトを返す先読みクエリ\(ℓ(s)\)で表現)を指定する必要があります。
At a high level, our model implementation consists of alternating steps of (1) following a planned path to the goal, and (2) re-planning whenever an obstacle is observed to impede the execution of the plan. The state of the model \(s = (x,y,π)\) is given by the current position of the agent, marked by a horizontal and vertical position x,y, and the currently active planned path, denoted by \(π\). We represent plans as sequences of desired states: \(π = [(x_0,y_0),...(x_n,y_n)]\). Following Ho et al. (2022), we initialize the construal to contain the center cross obstacle at the beginning of every simulation.
大まかに言うと、我々のモデル実装は、(1) 目標までの計画された経路を辿るステップと、(2) 計画の実行を妨げる障害物が観測されるたびに再計画するステップという、交互のステップから構成される。モデルの状態 \(s = (x,y,π)\) は、エージェントの現在の位置(水平位置 x,y と垂直位置 x で示される)と、現在アクティブな計画経路(\(π\) で示される)によって与えられる。計画は、望ましい状態のシーケンスとして表される:\(π = [(x_0,y_0),...(x_n,y_n)]\)。Ho et al. (2022) に従い、各シミュレーションの開始時に、中央の交差障害物を含むように構成を初期化する。
Dynamics. A simulation proceeds by following the computed plan until either the goal is reached, or a possible collision is flagged. We assume no sources of motor or perceptual error, so that the intended transitions are always reached. At each step, the simulated agent transitions to the next state specified by the plan, so that
\(f(x,y,π) = (next(π)x,next(π)y,rest(π))\) with probability 1.
ダイナミクス。シミュレーションは、計算された計画に従って、目標に到達するか、衝突の可能性がフラグ付けされるまで進行します。運動や知覚の誤差要因は想定していないため、意図した遷移が常に達成されます。各ステップにおいて、シミュレートされたエージェントは計画で指定された次の状態に遷移します。つまり、確率1で
\(f(x,y,π) = (next(π)x,next(π)y,rest(π))\) となります。
Plans are found using a noisy variant of the A⋆ search algorithm (Zhi-Xuan et al., 2020). The standard \(A^⋆\) algorithm is deterministic, and expands nodes to consider according to the following rule:
プランは、A⋆探索アルゴリズム(Zhi-Xuan et al., 2020)のノイズ付き変種を用いて探索されます。標準的な\(A^⋆\)アルゴリズムは決定論的であり、以下の規則に従って検討対象となるノードを拡張します。
\[
n^\prime = \arg \min\limits_n d(n) + h(n)
\]
where \(d\) is the distance from the start, and \(h\) is a heuristic estimate of the distance to the goal. We use the Manhattan distance as the heuristic function. To allow \(A^⋆\) to sample feasible paths probabilistically, we instead expand nodes using the softmax choice rule:
ここで、\(d\)はスタート地点からの距離、\(h\)はゴール地点までの距離のヒューリスティック推定値です。ヒューリスティック関数としてマンハッタン距離を用います。\(A^⋆\)が実行可能な経路を確率的にサンプリングできるように、代わりにソフトマックス選択規則を用いてノードを拡張します。
\[
n^\prime \sim \text{softmax}(−(α_d d(n) + α_h h(n)))
\]
Above, \α_d\) and \(α_h\) are free parameters that control the degree to which the algorithm greedily or systematically explores the maze. After search terminates, the optimal path must be reconstructed from the states visited by the search algorithm. When equally good options are presented for extending the path, we preferentially pick the next state that continues along the straight line trajectory of the past few states. This straight line bias in \(A^⋆\) search is intended to capture the comparative ease of pressing the same key over switching keys when moving the agent in the experiment, and produces trajectories that more closely match participant's empirical behavior.
上記において、\α_d\) と \(α_h\) は、アルゴリズムが迷路を貪欲に、あるいは体系的に探索する度合いを制御する自由パラメータです。探索が終了した後、探索アルゴリズムが訪れた状態から最適な経路を再構築する必要があります。経路を延長するための同等に優れた選択肢が提示された場合、過去のいくつかの状態の直線軌道に沿って続く次の状態を優先的に選択します。\(A^⋆\) 探索におけるこの直線バイアスは、実験においてエージェントを移動させる際に、キーを切り替えるよりも同じキーを押す方が比較的容易であることを捉え、参加者の実験行動により近い軌道を生成することを目的としています。
Lookahead. We assume that the agent running the simulation is performing a one-step lookahead and only checking the validity of the next move against the visual scene. Formally, the lookahead function ℓ flags objects only if they intersect the next proposed step of the plan:
先読み。シミュレーションを実行するエージェントは、1ステップ先読みを行い、視覚的なシーンに対して次の動きの妥当性のみを確認していると仮定します。正式には、先読み関数ℓは、計画の次のステップと交差するオブジェクトのみにフラグを付けます。
\[
ℓ(x,y,π) = \{o_i \in O|next(π) \in o_i\}
\]
If we find a possible collision, then we add the object to the construal and sample a new plan:
衝突の可能性があると判明した場合は、そのオブジェクトをコンストラクチュアルに追加し、新しいプランをサンプリングします。
\[
π_{new} \sim A^⋆(x,y,g,C_s)
\]
Parameter fitting. In sum, our model consists of three free parameters αd,αh,γ that were fit to human data. We choose these parameters through a grid-search procedure to maximize the Pearson correlation coeficient r between our model's predictions and human responses. Following Ho et al., (2022), separate parameters were fit for each dependent measure in each experiment. Because the process tracing experiments involve purely planning-based processes and no memory component, we fix \(γ = 0\) for fitting these experiments and only fit the two \(A^⋆\) weights \(α_d,α_h\).
パラメータフィッティング:つまり、私たちのモデルは、人間のデータに適合した3つの自由パラメータαd、αh、γで構成されています。これらのパラメータは、モデルの予測値と人間の反応との間のピアソン相関係数rを最大化するために、グリッドサーチ手順で選択します。Ho et al., (2022)に従い、各実験の各従属指標に個別のパラメータが適合されました。プロセストレーシング実験は純粋に計画ベースのプロセスであり、記憶コンポーネントは含まれないため、これらの実験の適合には\(γ = 0\)を固定し、2つの\(A^⋆\)重み\(α_d、α_h\)のみを適合させます。
The physical simulation case is closely analogous to the planning case. Here the loop is alternating (1) simulating the motion of the ball using a stochastic physics simulator, and (2) adding an object to the representation and continuing the simulation if an obstacle is observed to be near the simulated path of the ball. We implement the simplest form of visual lookahead, by assuming that a participant always looks or attends where the simulated ball is in their mind's eye (Gerstenberg et al., 2017; Huber & Krist, 2004), and an object is flagged when it enters their fovea. The state of the simulation
s = (q,v) is the current position of the tracked ball q and its velocity v, and we initialize the construal to only contain the ball and the goal.
物理シミュレーションのケースは、プランニングのケースと非常に類似しています。ここでは、ループは (1) 確率的物理シミュレータを用いてボールの動きをシミュレートし、(2) ボールのシミュレートされた経路の近くに障害物があると観測された場合、表現にオブジェクトを追加してシミュレーションを継続することを交互に繰り返します。参加者は常にシミュレートされたボールが心の中でどこにあるかを見ている(Gerstenberg et al., 2017; Huber & Krist, 2004)と仮定し、オブジェクトが中心窩に入るとフラグが付けられるという仮定のもと、最も単純な形式の視覚的先読みを実装します。シミュレーションの状態
s = (q,v) は、追跡されているボールの現在の位置 q とその速度 v であり、ボールとゴールのみを含むように構成を初期化します。
Dynamics. The true state of a plinko board unfolds according to the physical laws of motion, as calculated by the Pymunk 2d physics engine (Blomqvist, 2007). However, following work in intuitive physics, we assume that humans lack the ability to exactly simulate the positions and velocities of the objects, and instead instantiate our dynamics using a simulator implementing stochastic variants of Newtonian physics (Smith & Vul, 2013). Our simulator incorporates three sources of noise (Allen et al., 2020). We first apply a random shift to the ball's initial x position, based on a Gaussian distribution centered at the ball with variance \(σ^2\). When a collision occurs, we randomly rotate the collision normal by drawing a rotation angle from a Von Mises distribution centered at 0 and with variance \(κ\), and also randomly perturb the collision restitution, by sampling from a truncated normal distribution with variance \(s^2\).
ダイナミクス。プリンクボードの真の状態は、Pymunk 2d物理エンジン(Blomqvist、2007)によって計算された物理運動法則に従って展開されます。しかし、直感的な物理学の研究に従い、人間には物体の位置と速度を正確にシミュレートする能力がないと仮定し、代わりにニュートン力学の確率的変種を実装したシミュレータを使用してダイナミクスをインスタンス化します(Smith&Vul、2013)。私たちのシミュレータには、3つのノイズ源が組み込まれています(Allenら、2020)。まず、ボールを中心とし、分散\(σ^2\)を持つガウス分布に基づいて、ボールの初期x位置にランダムなシフトを適用します。衝突が発生すると、0を中心とし分散\(κ\)を持つフォン・ミーゼス分布から回転角度を描画して衝突法線をランダムに回転させ、また、分散\(s^2\)を持つ切り捨て正規分布からサンプリングして衝突復元をランダムに摂動させます。
Lookahead. We assume that the agent is always visually matching their gaze to the position of the simulated ball, and that visual attention forms a simple circular spotlight centered on the current position of the ball in simulation:
先読み。エージェントは常にシミュレートされたボールの位置に視線を視覚的に合わせており、視覚的な注意はシミュレーション内のボールの現在の位置を中心とした単純な円形のスポットライトを形成すると仮定します。
\[
ℓ_r(q,v) = \{o_i \in O : ||o_i − (q_x,q_y)||^2 \leq r\}
\]
For all simulations, we fix r = 25 pixels (4% of the width of the scenario).
すべてのシミュレーションでは、r = 25 ピクセル (シナリオの幅の 4%) に固定します。
Parameter fitting. In a supplemental experiment (Section S1.3), participants
were asked to rate the likelihood that the ball would hit a randomly chosen object in the world. Again, we fit simulator noise parameters via grid search: running 500 noisy simulations for each parameter setting, and maximizing the correlation between the collision likelihoods predicted by humans to those predicted by the model. The decay parameter γ was fit directly to the recall experiment 2A, again to maximize the correlation coeficient between recall and model predictions; the table of best-fitting parameters is shown in Supplemental table S1. We re-use the exact same fitted parameters to generate model predictions in experiment 2B.
パラメータフィッティング 補足実験(セクションS1.3)では、参加者はボールがランダムに選ばれた物体に衝突する可能性を評価するよう求められました。ここでも、グリッドサーチを用いてシミュレータのノイズパラメータをフィッティングしました。各パラメータ設定で500回のノイズ付きシミュレーションを実行し、人間が予測した衝突確率とモデルが予測した衝突確率の相関を最大化しました。減衰パラメータγは、再現率実験2Aに直接フィッティングされ、再現率とモデル予測の相関係数を最大化しました。最も適合したパラメータの表は補足表S1に示されています。実験2Bでは、全く同じフィッティングパラメータを再利用してモデル予測を生成します。
Participants. We recruited 220 participants through the online platform Prolific. The experiment took 28 minutes on average, and participants were compensated $6.25 for their time.
Procedure. Participants engaged in a two stage (prediction and memory probe) task. They first made predictions for where the ball might fall, and were then probed on their memory of the scene they had just made predictions for. We segmented 1/3rd of the trials into “critical trials”, and the other 2/3rds into “filler trials”, with only the critical trials containing the second memory phase.
参加者:オンラインプラットフォームProlificを通じて220名の参加者を募集しました。実験には平均28分かかり、参加者には時間に対して6.25ドルの報酬が支払われました。
手順:参加者は2段階(予測と記憶調査)の課題に取り組みました。まず、ボールが落ちる場所を予測し、次に、予測した場面の記憶について調査を受けました。試験の3分の1を「クリティカル試験」、残りの3分の2を「フィラー試験」に分け、クリティカル試験のみに2段階目の記憶段階を含めました。
In the prediction stage, participants viewed the initial scene containing the ball suspended above a series of obstacles, and make predictions about where the ball would land, once let go. We asked participants to indicate their predictions by clicking 10 times on the ground where they believed the ball would land, and to indicate more or less confidence by concentrating the predictions closer or more diffusely, respectively.
予測段階では、参加者は一連の障害物の上に浮かぶボールを含む最初のシーンを見て、ボールが手を離した後にどこに着地するかを予測しました。参加者には、ボールが着地すると思われる地面を10回クリックすることで予測を示してもらいました。また、予測を集中させるか分散させるかで、確信度の高低を示してもらいました。
On the critical trials, we presented participants with an additional recall question that probed for their memory of a specific object in the scene. We generated the memory test by superimposing the previously viewed original scene on top of a distractor scene in which one object had been randomly translated. The shift ranged from 10 to 50 pixels (1.7 to 8.3 percent of the scene) in magnitude, and was applied in a random direction. The original and translated object were colored red and blue (randomized between trials); participants were then asked to indicate which object was the original correct one, by indicating their response on a slider ranging from “definitely sure the red object is in the correct position”, to “definitely sure the blue object is in the correct position”, with the middle of the slider being labeled “completely unsure”. For participants that set the slider to “completely unsure”, we code their answer as not correct.
重要な試行では、参加者に、シーン内の特定のオブジェクトに関する記憶を調べるための追加の想起質問を提示しました。記憶テストは、以前に見た元のシーンを、オブジェクト 1 つがランダムに移動された妨害シーンの上に重ね合わせることで生成しました。移動の大きさは 10 ~ 50 ピクセル (シーンの 1.7 ~ 8.3%) で、方向はランダムでした。元のオブジェクトと移動されたオブジェクトは赤と青に色付けされました (試行間でランダム化)。次に、参加者は、どちらのオブジェクトが元の正しいオブジェクトであるかを示すように求められました。回答は、「赤いオブジェクトが正しい位置にあることは間違いない」から「青いオブジェクトが正しい位置にあることは間違いない」までのスライダーで示され、スライダーの中央には「全くわからない」というラベルが付けられていました。スライダーを「全くわからない」に設定した参加者については、回答が不正解であるとコード化しました。
Finally, the participants were shown their score for that given trial. For each prediction, we discretized the ground plane into 10 buckets, and calculated the point score for each prediction \(\hat{x}\) and ground truth \(x\) as \(10 − |\hat{x} − x|\). We then summed up the point score for each of the 10 predictions to obtain the overall points gained on the trial. This score was not analyzed or used for anything beyond providing participants with motivation. The points display was followed by a video showing the actual path that the ball would take, when gravity is turned on.
最後に、参加者にはその試行のスコアが表示されました。各予測について、地面を10個のバケットに分割し、各予測値 \(\hat{x}\) と正解値 \(x\) の得点を \(10 − |\hat{x} − x|\) として計算しました。そして、10個の予測値それぞれの得点を合計し、その試行で獲得した総合得点を算出しました。この得点は、参加者にモチベーションを与える以外の目的で分析または使用されませんでした。得点表示の後には、重力がかかった状態でボールが実際に進む軌道を示すビデオが再生されました。
Materials. Scenarios were constructed to contain a variety of objects that interacted with the ball in different ways. Critical stimuli contained objects satisfying at least three of four types of ball-object interactions according to noisy physical simulation. Early collision objects were hit by the ball with > 95% probability, and were always hit in the top half of the environment, late collision objects were also hit with > 95% probability but were contacted in the lower half of the world, maybe collision objects were hit by the ball between 40 and 60 percent of the time, and no collision objects were never hit by the ball. We used the noisy simulator from Allen et al., (2020) to estimate these probabilities for each world, as stimulus creation necessarily was done before experiments and parameter fitting. After running Experiment 2A, a mixed effects model regressing object type on memory with random intercepts by participants showed a statistically significant effect (\(χ^2(3) = 268.37 p \approx 0\)), verifying that our procedure did produce objects with substantially different memory profiles. The trials used in this experiment can be seen in the heatmaps of Extended Figures E6 and E7, and code for running the experiments can be found at https://github.com/chentoast/physics_repr.
材料:シナリオは、ボールとさまざまな方法で相互作用するさまざまなオブジェクトを含むように構築されました。重要な刺激には、ノイズのある物理シミュレーションによると、ボールとオブジェクトの相互作用の4つのタイプのうち少なくとも3つを満たすオブジェクトが含まれていました。初期の衝突オブジェクトは95%を超える確率でボールに当たり、常に環境の上半分で当たり、後期の衝突オブジェクトも95%を超える確率で当たりますが、世界の下半分で接触し、衝突オブジェクトは40~60%の時間でボールに当たっており、衝突オブジェクトにはボールが当たらない可能性がありました。刺激の作成は必然的に実験とパラメータのフィッティングの前に行われるため、各世界のこれらの確率を推定するために、Allenら(2020)のノイズシミュレータを使用しました。実験2Aを実施した後、被験者によるランダム切片を用いて物体の種類と記憶を回帰する混合効果モデルにおいて、統計的に有意な効果(\(χ^2(3) = 268.37 p \approx 0\))が示され、本手順によって記憶プロファイルが大きく異なる物体が生成されたことが確認されました。本実験で使用した試行は、拡張図E6およびE7のヒートマップで確認できます。実験実行用のコードはhttps://github.com/chentoast/physics_reprで入手できます。
Filler trials were generated by procedurally filling the world with 8-12 objects, and placing the ball at a random horizontal position. We then manually narrowed down the list of generated candidates to 12 worlds.
フィラートライアルは、8~12個のオブジェクトをプロシージャルにワールドに埋め込み、ボールをランダムな水平位置に配置するという方法で生成されました。その後、生成された候補ワールドのリストを手動で12個に絞り込みました。
Participants. We recruited 50 participants from Prolific. The experiment took 15 minutes on average, and participants were compensated $4.50 for their time.
参加者:Prolific社から50名の参加者を募集しました。実験には平均15分かかり、参加者には時間に対して4.50ドルの報酬が支払われました。
Procedure. The procedure was identical to Experiment 1 except that the predictions were discretized: the ground area was segmented into five “buckets” and participants were instructed to select the bucket that the ball was most likely to fall into. The feedback and memory test phases were otherwise the same.
手順:手順は実験1と同一ですが、予測が離散化された点が異なります。地面を5つの「バケツ」に分割し、参加者はボールが最も落ちそうなバケツを選択するよう指示されました。フィードバックと記憶テストの段階は、その他の点では実験1と同一です。
Materials. The filler trials were the same as in Experiment 1. However, the critical trials were constructed to have two different types of obstacles for the memory test. These obstacle types were chosen because the JIT and VGC models would produce a different ordering of representational strength between the two types.
材料:フィラー試行は実験1と同じであった。しかし、クリティカル試行では記憶テストのために2種類の異なる障害物を用意した。これらの障害物が選択されたのは、JITモデルとVGCモデルが2種類の障害物の間で表象強度の順序付けに異なる結果をもたらすためである。
Half of the trials were constructed to have a “counterfactually irrelevant” object: an obstacle that was certain to be hit by the ball (similar to the “early collision” obstacles), but in such a way that, due to the geometry of other obstacles, the bucket that the ball was almost certain to end up in (> 95% under the simulation model) was the same bucket that the ball would end up in if the lure obstacle were removed from the scene. Theseobjects had high relevance under the JIT model as they were always contacted, but because the outcome would barely differ, had little relevance under the VGC model.
試行の半数は、「反事実的に無関係な」オブジェクトを持つように構築されました。これは、ボールが確実に当たる障害物(「早期衝突」障害物に類似)ですが、他の障害物の形状により、ボールがほぼ確実に入るバケツ(シミュレーションモデルでは95%以上)は、ルアー障害物がシーンから除去された場合にボールが入るバケツと同じでした。これらのオブジェクトは、JITモデルでは常に接触するため高い関連性を示しましたが、結果がほとんど変わらないため、VGCモデルではほとんど関連性を示しませんでした。
The other half of the trials were constructed to have a “counterfactually relevant” object: an obstacle that was only likely to be contacted about half the time according to the noisy simulation model, but if it is contacted, would certainly change the ending bucket the ball would land in as compared to if that obstacle were not there. These objects would have high relevance under the VGC model because its inclusion always makes a difference in the outcome, but only moderate relevance under the JIT model as they are included only in the half of simulations that involves the ball contacting them.
残りの半分の試行は、「反事実的に関連する」オブジェクトを含むように構成されました。これは、ノイズを含むシミュレーションモデルによれば、接触する可能性が約半分しかない障害物ですが、接触した場合、ボールが着地する最終的なバケットは、障害物がない場合と比較して確実に変化します。これらのオブジェクトは、VGCモデルでは高い関連性を持ちます。なぜなら、そのオブジェクトを含めることで常に結果に違いが生じるからです。しかし、JITモデルでは、ボールが接触するシミュレーションの半分にしか含まれていないため、関連性は中程度です。
The trials used in this experiment can be seen in the heatmaps of Extended Figure E9,E10 and found at https://github.com/chentoast/physics_repr
この実験で使用された試行は、拡張図E9、E10のヒートマップで確認でき、https://github.com/chentoast/physics_reprで見つけることができます。
TC, SC, KS, and JT formulated the model; TC implemented the model, ran the behavioral experiments, and analyzed the data; TC, KA, and KS conceived of the main project; TC, SC, KS wrote the manuscript with assistance from KA and JT.
TC、SC、KS、および JT がモデルを策定し、TC がモデルを実装し、行動実験を実行してデータを分析しました。TC、KA、および KS がメイン プロジェクトを考案し、TC、SC、KS が KA と JT の支援を受けて原稿を書きました。
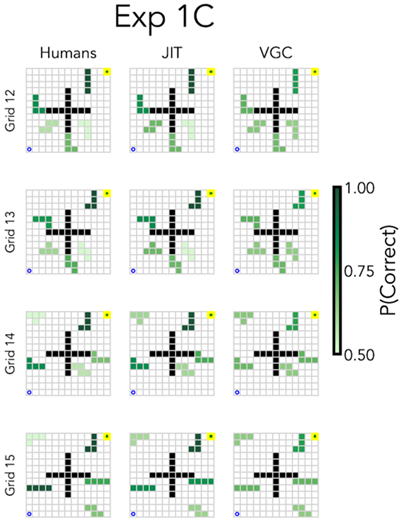
Figure E1 Model predictions and human results for the four mazes tested in Experiment 1C. The center cross obstacle was present in all mazes, and was not probed in the memory tests. Darker green objects were more likely to be recalled by participants, and more likely to be represented in the models.
図E1 実験1Cでテストされた4つの迷路におけるモデル予測と人間の結果。中央の十字形障害物はすべての迷路に存在し、記憶テストでは探査されなかった。濃い緑色の物体は参加者に想起されやすく、モデルにも再現されやすかった。
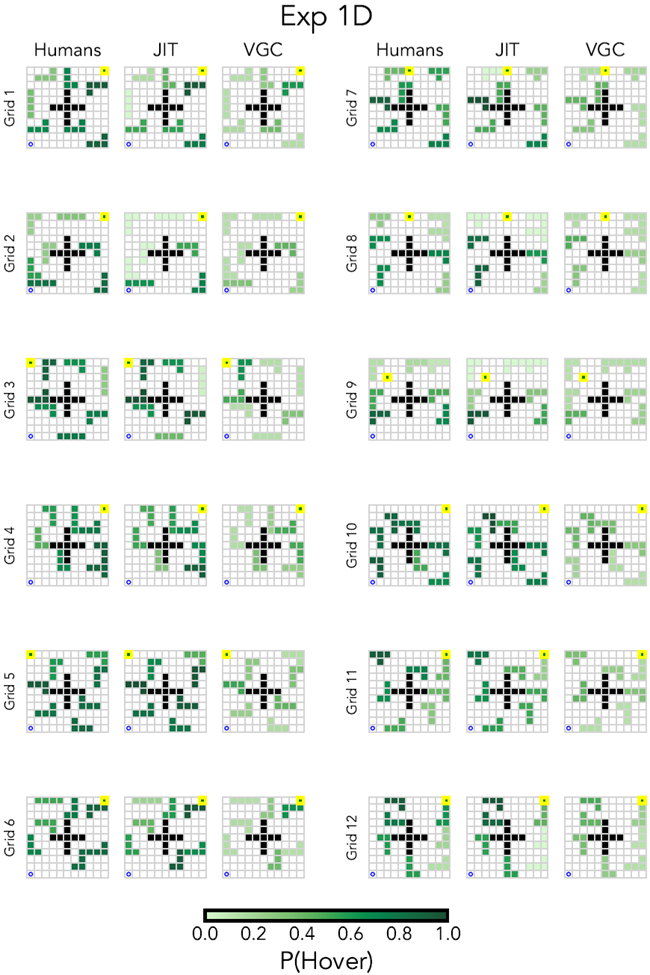
Figure E2 Model and human predictions for the mazes tested in Experiment 1D. Darker green objects were more likely to be hovered by the participant's mouse while planning, and more likely to be represented in the models.
図E2 実験1Dでテストされた迷路のモデルと人間の予測。濃い緑色の物体は、計画中に参加者のマウスがホバリングする可能性が高く、モデルに表現される可能性も高かった。
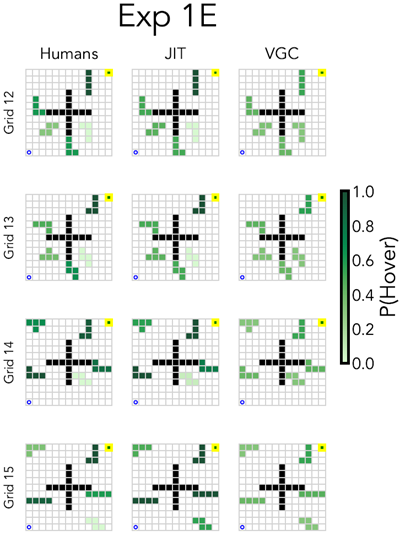
Figure E3 Model and human predictions for the four mazes tested in Experiment 1E. Darker green objects were more likely to be hovered by the participant's mouse while planning, and more likely to be represented in the models.
図E3 実験1Eでテストされた4つの迷路におけるモデルと人間の予測。濃い緑色の物体は、計画中に参加者のマウスがホバリングする可能性が高く、モデルに表現される可能性も高かった。
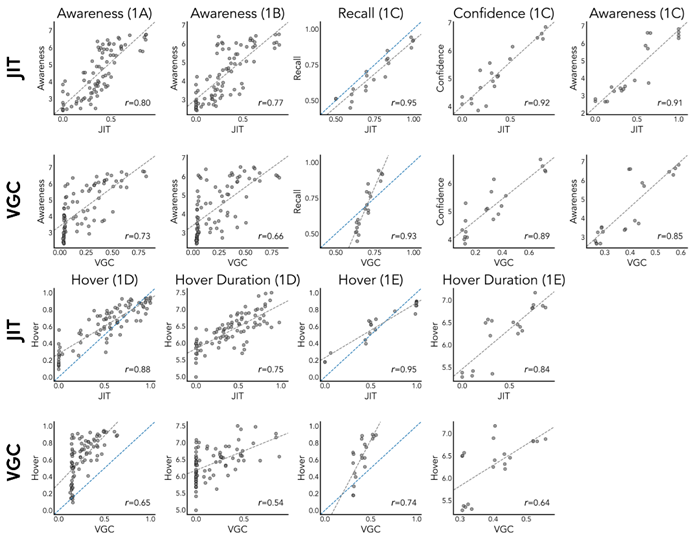
Figure E4 Scatterplots comparing JIT (upper rows) and VGC (lower rows) predictions against human results for each of the 9 dependent measures studied in Ho et al. (2022). Awareness denotes explicit judgments of how aware participants were of each object in the maze; Recall denotes the probability of correct recall in the memory probe; Confidence denotes participants' confidence in their answer on the memory probe; Hover denotes the probability an object is hovered by the mouse during the process-tracing experiments; and Hover Duration is the average log duration that each object was hovered over for. Gray dashed lines denote the line of best fit; for measures that lie in a [0,1] range, the blue dashed line denotes the identity line.
図E4 Hoら(2022)で研究された9つの従属指標それぞれについて、JIT(上段)とVGC(下段)の予測と人間の結果を比較した散布図。Awarenessは、参加者が迷路内の各オブジェクトをどの程度認識していたかの明示的な判断を示します。Recallは、記憶プローブで正しく思い出す確率を示します。Confidenceは、参加者が記憶プローブに対する自分の答えに自信があることを示します。Hoverは、プロセス追跡実験中にマウスがオブジェクトの上にホバーする確率を示します。Hover Durationは、各オブジェクトの上にホバーしていた平均対数継続時間です。灰色の破線は最もよく適合する線を示します。[0,1]の範囲にある指標の場合、青い破線は恒等線を示します。
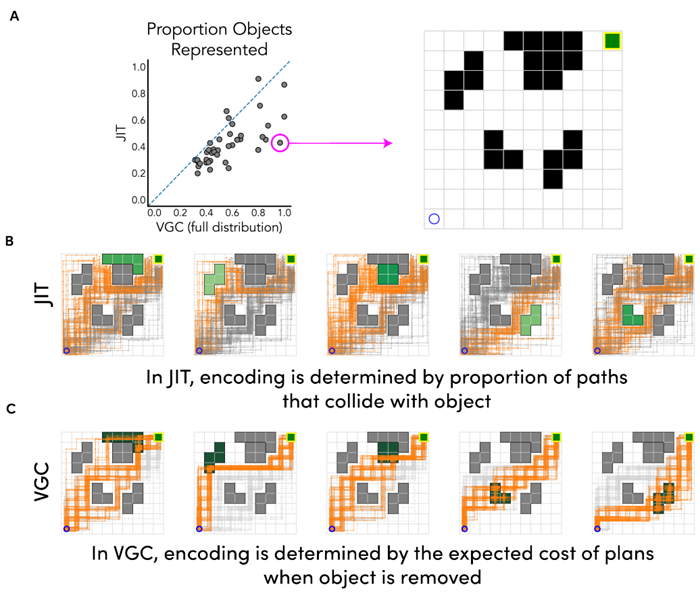
Figure E5 A. A procedurally generated world where JIT represents less than half the objects as VGC. The scatterplot is the same as Fig. 3C, labeling the world in current focus. B. JIT predictions for each object, with darker green representing objects more likely to be included in the construal. Gray lines denote trajectories that did not encounter the highlighted object, and orange lines denote trajectories that did encounter and represent the object. C. VGC predictions for each object, with darker green representing higher utility objects (note that all objects have high utility). Lines denote rollouts sampled from the construal policy that represents all objects except for the highlighted one. Gray trajectories attain the optimal trajectory value, while orange lines do not. For objects on the periphery of the maze, JIT samples paths that often avoid those objects entirely, whereas when those same objects are excluded from the construal, VGC finds many paths that will consistently try to move through the excluded objects and thus incur low value.
図E5 A. JITがVGCとして半分以下のオブジェクトを表す、手続き的に生成された世界。散布図は図3Cと同じで、現在焦点になっている世界にラベルを付けています。B. 各オブジェクトのJIT予測。濃い緑色は、構築に含まれる可能性が高いオブジェクトを表します。灰色の線は、強調表示されたオブジェクトに遭遇しなかった軌跡を示し、オレンジ色の線は、オブジェクトに遭遇してそれを表現した軌跡を示します。C. 各オブジェクトのVGC予測。濃い緑色は、ユーティリティの高いオブジェクトを表します(すべてのオブジェクトが高いユーティリティを持っていることに注意してください)。線は、強調表示されたオブジェクトを除くすべてのオブジェクトを表す構築ポリシーからサンプリングされたロールアウトを示します。灰色の軌跡は最適な軌跡値を達成しますが、オレンジ色の線は達成しません。迷路の周囲のオブジェクトの場合、JIT はそれらのオブジェクトを完全に回避するパスをサンプリングしますが、同じオブジェクトが解釈から除外されると、VGC は除外されたオブジェクトを一貫して通過しようとするパスを多数検出し、その結果、値が低くなります。
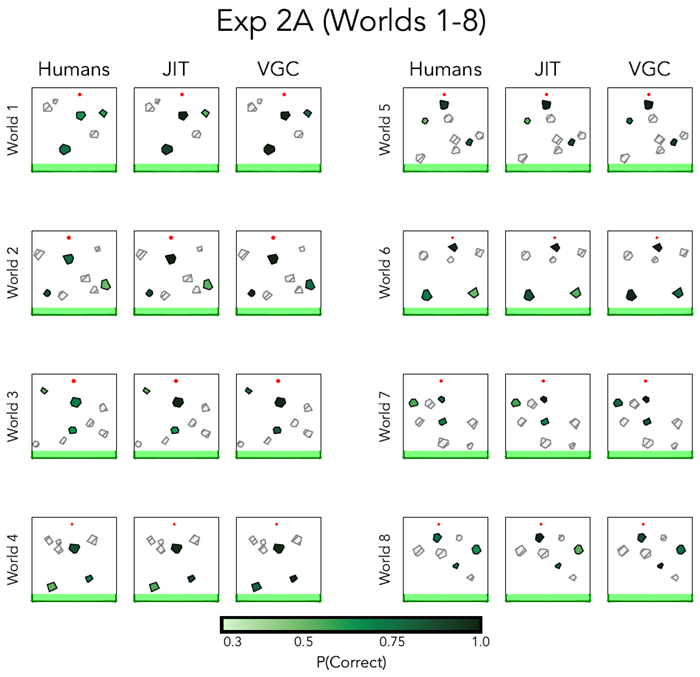
Figure E6 Model predictions and human recall for the worlds 1-8 in Experiment 2A. Darker green denotes higher recall accuracy, and lighter green denotes lower recall accuracy. We did not probe memory for the light gray hatched objects.
図E6 実験2Aの世界1~8におけるモデル予測と人間の想起。濃い緑は想起精度が高いことを示し、薄い緑は想起精度が低いことを示す。薄い灰色の網掛け部分については記憶を調査しなかった。
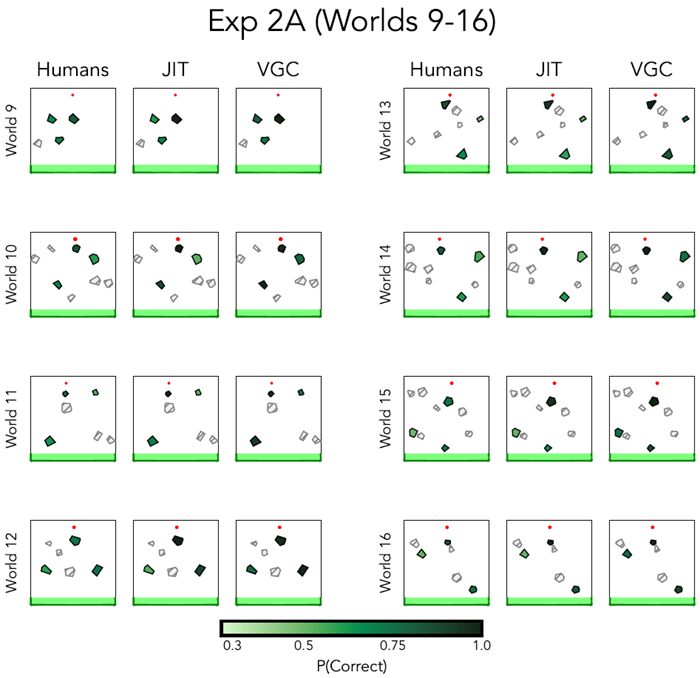
Figure E7 Model predictions and human recall for the worlds 9-16 in Experiment 2A. Darker green denotes higher recall accuracy, and lighter green denotes lower recall accuracy. We did not probe memory for the light gray hatched objects.
図E7 実験2Aの世界9~16におけるモデル予測と人間の想起。濃い緑は想起精度が高いことを示し、薄い緑は想起精度が低いことを示す。薄い灰色の網掛け部分については記憶を調査しなかった。
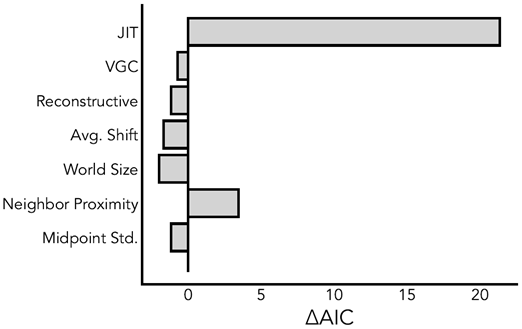
Figure E8 Model comparisons visualizing predictive power of the JIT model and a set of alternative predictors for human memory in Experiment 2A. In order from top to bottom, these alternative predictors are: VGC, a reconstructive baseline (see Supplemental Fig. S7) using counterfactual simulation to determine recall, the average distance of the distractor stimulus to the true object, number of objects in the world, proximity of the probed object to its nearest neighboring object, and the average standard deviation of positions. Bar lengths denote the change in AIC when removing that predictor from a mixed effects model with random intercepts by participant and all predictors as covariates. Except for the neighbor proximity, all other predictors do not explain substantial variance on top of JIT.
図E8 実験2AにおけるJITモデルと人間の記憶の代替予測因子セットの予測力を視覚化したモデル比較。上から下の順に、これらの代替予測因子は、VGC、想起を決定するために反事実的シミュレーションを使用した再構成ベースライン(補足図S7を参照)、気晴らし刺激から真の物体までの平均距離、世界内の物体数、探査された物体からその最も近い隣接物体までの距離、位置の平均標準偏差である。バーの長さは、参加者によるランダム切片とすべての予測因子を共変量とした混合効果モデルからその予測因子を除去したときのAICの変化を示す。隣接物体への距離を除いて、他のすべての予測因子はJITに加えて大きな変動を説明しない。
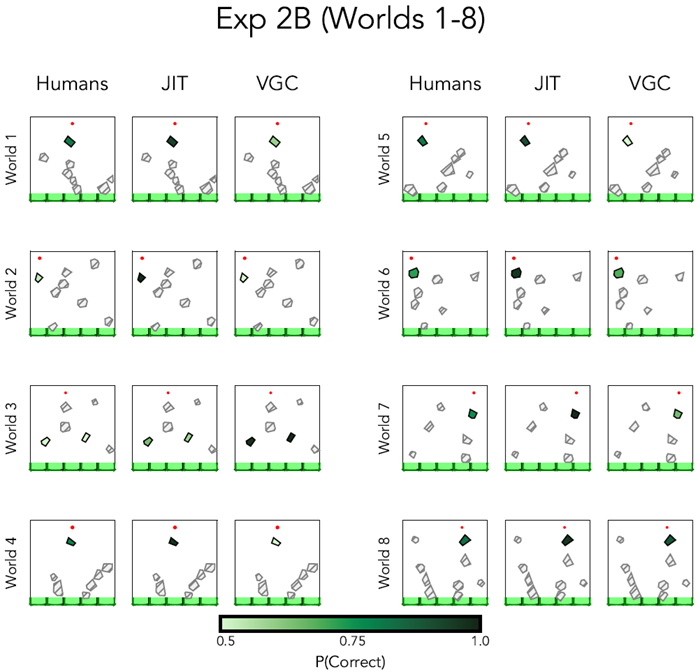
Figure E9 Model predictions and human recall for the worlds 1-8 in Experiment 2B. Darker green denotes higher recall accuracy, and lighter green denotes lower recall accuracy. We did not probe memory for the light gray hatched objects.
図E9 実験2Bの世界1~8におけるモデル予測と人間の想起。濃い緑は想起精度が高いことを示し、薄い緑は想起精度が低いことを示す。薄い灰色の網掛け部分については記憶を調査しなかった。
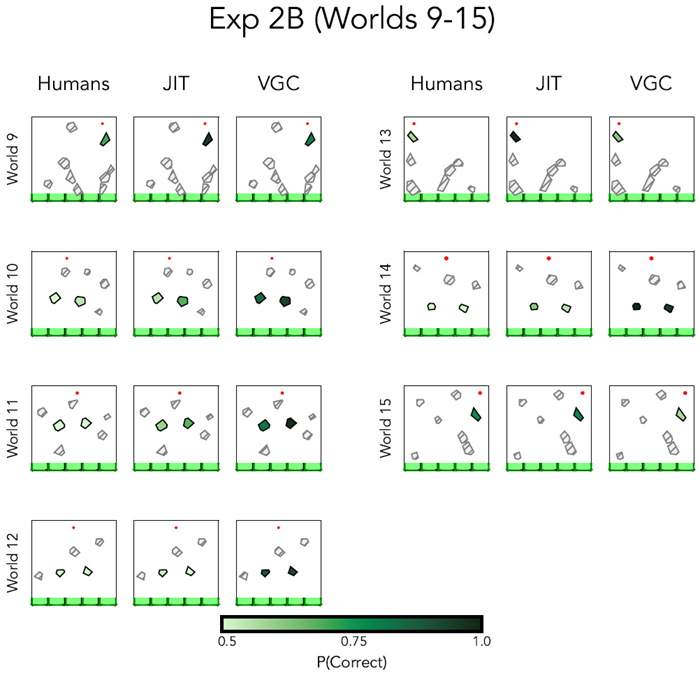
Figure E10 Model predictions and human recall for the worlds 9-15 in Experiment 2B. Darker green denotes higher recall accuracy, and lighter green denotes lower recall accuracy. We did not probe memory for the light gray hatched objects.
図E10 実験2Bの世界9~15におけるモデル予測と人間の想起。濃い緑は想起精度が高いことを示し、薄い緑は想起精度が低いことを示す。薄い灰色の網掛け部分については記憶を調査しなかった。
We ran two additional experiments to test whether recall on the physics memory probe tasks might have been driven by shallow visual features instead of the depth of representational encoding. In Experiment S1, we change the nature of some obstacles from “foreground” to “background” to test whether memory is driven by simply looking at the object. In Experiment S2, we add “teleporters” with different functionality for different sets of participants to test whether it is simple visual layout of the scene driving recall. In both cases, we find that encoding relies on whether objects are relevant to the simulation of the ball's motion, and not simply visual features.
物理記憶探査課題における想起が、表象のエンコーディングの深さではなく、浅い視覚的特徴によって駆動されているかどうかを検証するため、さらに2つの実験を行った。実験S1では、いくつかの障害物の性質を「前景」から「背景」に変更し、記憶が単に物体を見ることで駆動されるかどうかを検証した。実験S2では、参加者のグループごとに異なる機能を持つ「テレポート装置」を追加し、シーンの単純な視覚的レイアウトが想起を駆動しているかどうかを検証した。どちらの場合も、エンコーディングは、物体がボールの動きのシミュレーションに関連しているかどうかに依存しており、単なる視覚的特徴に依存していないことがわかった。
Additionally, we ran Experiment S3, asking participants to directly rate the probability critical blocks would be contacted, in order to calibrate parameters for the simulation model used in Experiments 2A and 2B.
さらに、実験 2A および 2B で使用されるシミュレーション モデルのパラメータを調整するために、参加者に重要なブロックに接触する確率を直接評価してもらう実験 S3 を実行しました。
We recruited 100 participants using Prolific. The median time to complete the task was 22 minutes, and participants were compensated $5.00.
Prolificを用いて100名の参加者を募集しました。タスク完了までの時間の平均は22分で、参加者には5ドルの報酬が支払われました。
The procedure was identical to Physics Experiment 2A in the main paper. We used the same set of 16 critical worlds, but additionally separated objects into two categories, colored either brown or blue. Foreground objects are solid, and the ball bounces off of them as normal, whereas background objects are completely ephemeral, and the ball passes through them as if they were painted sections of the wall. The color used to indicate object category was counterbalanced across participants.
手順は本論文の物理学実験2Aと同一です。16個の臨界世界セットを使用しましたが、物体を茶色と青の2つのカテゴリーに分類しました。前景の物体は固体で、ボールは通常通り跳ね返りますが、背景の物体は完全に消え去り、ボールは壁の一部に描かれたかのように通過します。物体のカテゴリーを示す色は、参加者間でバランスが取られました。
We also re-use the same memory probes as Experiment 2A. Because colors denote the solidity of objects in the task, instead of marking the target and lure objects by different colors, we instead display query objects as unfilled outlines, and named them either object A or object B. Participants were then asked to indicate whether object A or B was in the correct position.
実験2Aと同じ記憶プローブも再利用します。課題では物体の硬さが色で示されるため、ターゲット物体とルアー物体を異なる色でマークする代わりに、クエリ物体を塗りつぶされていない輪郭線で表示し、物体Aまたは物体Bと名付けました。参加者は、物体Aと物体Bのどちらが正しい位置にあるかを答えるように求められました。
Results are shown in Supplemental Figure S1. We again discretized objects into the four object categories defined in the Methods section. A mixed effects logistic regression with random interce2pts by participant found a strong main effect of object category, with memory for foreground objects being significantly higher than background objects
(\(χ^2\)(1) = 7.19, p = 0.007). Paired t-tests show that this effect was most significant in the early collision objects: t(15) = 4.23, p = 0.007, and non-existent in the no-collision objects: t(15) = −0.37, p = 0.71. Effects for the middle two object categories are weaker but directionally correct; we find a marginally significant effect for maybe collisions:
t(7) = 2.52, p = 0.04, and no effect for late collisions: t(7) = .78, p = 0.46.
結果は補足図S1に示す。我々は、方法セクションで定義した4つのオブジェクトカテゴリーにオブジェクトを再度分割した。参加者ごとにランダム切片を用いた混合効果ロジスティック回帰分析では、オブジェクトカテゴリーの強い主効果が認められ、前景オブジェクトの記憶は背景オブジェクトの記憶よりも有意に高かった(\(χ^2\)(1) = 7.19, p = 0.007)。対応のあるt検定の結果、この効果は衝突初期のオブジェクトで最も有意であり(t(15) = 4.23, p = 0.007)、衝突なしのオブジェクトでは認められなかった(t(15) = −0.37, p = 0.71)。中央の2つのオブジェクトカテゴリーへの影響は弱いものの、方向性は正しい。衝突の可能性については、わずかに有意な効果が見られました: t(7) = 2.52, p = 0.04。一方、衝突の遅延については、効果は見られませんでした: t(7) = .78, p = 0.46。
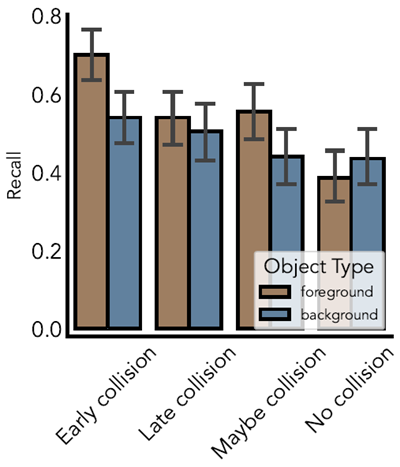
Figure S1 Human recall for the foreground and background variants of the same object. Objects were binned into one of four categories: collision early (contacted > 95% of the time under noisy simulation, and located in the top half of the environment), collision late (> 95% collision probability, located in lower half of environment), maybe collision (between 40 and 60 percent collision probability), and no collision objects. Memory was worse for objects presented in background form; this effect was modulated by object condition, such that foreground objects clearly hit by the ball show a greater difference in memory from objects not hit by the ball at all.
図S1 同じ物体の前景と背景のバリエーションに対する人間の想起。物体は、衝突早期(ノイズのあるシミュレーション下で95%以上の時間接触し、環境の上半分に位置する)、衝突後期(衝突確率95%以上、環境の下半分に位置する)、衝突の可能性あり(衝突確率40~60%)、衝突物体なしの4つのカテゴリーに分類された。背景に提示された物体については記憶が悪化した。この効果は物体の状態によって変調され、明らかにボールが当たった前景の物体は、ボールが全く当たっていない物体と比べて記憶に大きな差が生じた。
While experiment S1 shows that memory for objects cannot be entirely explained by visual attention during simulation, representations could still be driven by a primarily visual process as opposed to simulation. In Experiment S2, we present participants with matched scenes that are almost visually identical, yet have very different simulation profiles, and show that human memory patterns differ substantially between these pairs.
実験S1は、物体の記憶がシミュレーション中の視覚的注意だけでは完全に説明できないことを示していますが、表象はシミュレーションではなく、主に視覚的なプロセスによって駆動される可能性があります。実験S2では、視覚的にはほぼ同一でありながら、シミュレーションプロファイルが大きく異なる2つのシーンを被験者に提示し、人間の記憶パターンがこれらのペア間で大きく異なることを示します。
We recruited 100 participants on Prolific. The median time spent on the task was 18 minutes and participants were compensated $5.25 for their time.
Prolificで100名の参加者を募集しました。タスクに費やした時間の平均は18分で、参加者には時間に対して5.25ドルの報酬が支払われました。
We generate a new set of worlds containing teleporter objects. A teleporter pair consists of an entrance and an exit; when the ball contacts the entrance, it will instantly
re-appear at the center of the exit with the same velocity. The teleporter exit is not a solid object, and objects will simply pass through it. Just as in Experiment S1, the teleporter entry and exit objects were labeled by unique colors that were counterbalanced across participants. Matched scenes were generated by swapping the positions of the teleporter entry and exit. In “entry” scenes, the ball contacts the teleporter entrance and re-appears at the exit, and in “exit” scenes, the ball instead touches the teleporter exit and thus falls through uninterrupted.
テレポーターオブジェクトを含む新しいワールドセットを生成します。テレポーターペアは入口と出口で構成されます。ボールが入口に接触すると、ボールは同じ速度で出口の中心に瞬時に再出現します。テレポーター出口は固体ではないため、オブジェクトはそのまま通過します。実験S1と同様に、テレポーター入口オブジェクトと出口オブジェクトには、参加者間でバランスが取られた固有の色でラベル付けされました。テレポーター入口と出口の位置を入れ替えることで、対応するシーンが生成されました。「入口」シーンでは、ボールはテレポーター入口に接触して出口に再出現し、「出口」シーンでは、ボールはテレポーター出口に接触し、中断されることなく落下します。
We generated an initial set of candidate worlds using procedural generation procedure. After initializing a world with the ball and a set of 5-10 objects, we place the teleporters at random free positions, with the constraint that either the entrance or the exit must be the first object touched by the ball. We then proceeded to filter down the candidate set into a set of 10 worlds, and manually edited them to more cleanly distinguish outcomes in the “entry” versus “exit” variants.
手続き型生成手順を用いて、候補となるワールドの初期セットを生成しました。ボールと5~10個のオブジェクトからなるワールドを初期化した後、テレポーターをランダムな位置に配置します。ただし、ボールが最初に触れるオブジェクトは必ず入口か出口のどちらかでなければならないという制約を設けます。次に、候補セットを10個のワールドに絞り込み、「入口」と「出口」のバリアントにおける結果がより明確に区別されるように、手動で編集しました。
Results are shown in supplemental figure S2. A paired t-test shows that memory for the same object differs significantly depending on whether the object was hit by the ball or not: (t(17) = 4.07, p = 0.008). More specifically, we find that while memory for objects that are hit are recalled better than chance: mean: 0.69, t(17) = 7.79, p \(\approx\) 0, memory for objects that were not hit by the ball was not higher than chance. This is true both for objects that were not hit because of the configuration of the teleporters:
t(17) = 1.45, p = 0.17, and for objects located in the periphery, far from the ball's trajectory in either condition: t(8) = −0.64, p = 0.54.
結果は補足図S2に示す。対応のあるt検定では、同じ物体に対する記憶は、その物体がボールに当たったかどうかによって有意に異なることが示された: (t(17) = 4.07, p = 0.008)。より具体的には、ボールに当たった物体の記憶は偶然よりもよく思い出される: 平均: 0.69, t(17) = 7.79, p \(\approx\) 0)、ボールに当たらなかった物体の記憶は偶然よりも高くないことがわかる。これは、テレポーターの構成によって当たらなかった物体: t(17) = 1.45, p = 0.17、およびどちらの条件でもボールの軌道から遠く離れた周辺にある物体: t(8) = −0.64, p = 0.54の両方に当てはまる。
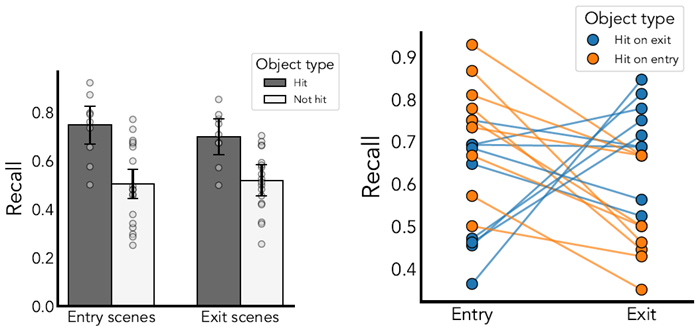
Figure S2 Left: memory for objects that collide with the ball (blue) and objects that do not (orange) in each type of world. Right: differences in memory for each object depending on whether participants viewed that object in an entry world or exit world. Blue objects are hit on exit worlds but not hit on entry worlds, and vice versa for orange objects. Lines connect paired objects.
図S2 左:各世界におけるボールと衝突する物体(青)と衝突しない物体(オレンジ)の記憶。右:参加者が各物体を入口世界で見たか出口世界で見たかによる記憶の違い。青い物体は出口世界ではボールに衝突するが、入口世界ではボールに衝突しない。オレンジ色の物体はその逆である。線はペアになった物体を結ぶ。
To fit the noise parameters of the simulator, we run an additional study where we directly ask participants for the likelihood that the ball will hit a given object. We then fit the noise parameters to maximize the Pearson correlation coeficient between the model predicted probability of the ball hitting an object with the empirical human predictions.
シミュレータのノイズパラメータを適合させるために、参加者にボールが特定の物体に当たる確率を直接尋ねる追加調査を実施しました。そして、モデルによるボールが物体に当たる確率の予測値と人間の経験的予測値との間のピアソン相関係数を最大化するようにノイズパラメータを適合させました。
We recruited 50 participants on Prolific. The median time to perform the task was 13 minutes and participants were compensated $3.50 for their time.
Prolificで50名の参加者を募集しました。タスク実行時間の平均は13分で、参加者には時間に対して3.50ドルの報酬が支払われました。
We use the same set of 16 critical worlds as Experiment 2A. After making predictions for where the ball would land, participants were taken to the next stage, where they were shown the same world with one object highlighted, and asked how likely they thought the ball was to hit that object. Participants gave their responses on a slider from “Definitely not going to hit”, to “Definitely going to hit”.
実験2Aと同じ16個の臨界世界セットを使用します。ボールがどこに落ちるかを予測した後、参加者は次の段階に進み、同じ世界の中で物体が1つハイライト表示された状態で提示され、ボールがその物体に当たる確率をどの程度考えるか尋ねられました。参加者は「絶対に当たらない」から「絶対に当たる」までのスライダーで回答しました。
The fitted parameter values are displayed in Table S1. Noisy simulations with the fitted parameter values are able to closely match the human-normed collision likelihoods for each object (r = 0.97,rmse = 0.09), as shown in Supplemental Figure S3.
適合パラメータ値は表S1に示されています。適合パラメータ値を用いたノイズシミュレーションは、補足図S3に示すように、各物体の人間基準の衝突確率(r = 0.97、rmse = 0.09)とほぼ一致しています。

Figure S3 Model predicted probabilities that the ball will collide with a target object compared to human predicted probabilities. Model predictions were generated using the simulation parameters fit in Supplemental Experiment 3.
図S3 ボールが目標物体に衝突する確率をモデルが予測した値と、人間が予測した値との比較。モデル予測は、補足実験3でフィッティングされたシミュレーションパラメータを用いて生成された。
Here, we provide additional details on the simulation analyses visualized in Main text Fig. 3.
ここでは、本文の図 3 に示されているシミュレーション解析の詳細について説明します。
\[
\begin{array}{c c c}
\hline
σ^2 & κ & s^2 \\
\hline
5.0 & 0.8 & 0.6 \\
\hline
\end{array}
\]
\[
\begin{array}{c c}
\hline
& \text{パラメータ}\\
\hline
\text{JIT} & γ=0.0 \\
\text{VGC} & α=20.0 \\
\hline
\end{array}
\]
Table S1 Upper: best-fitting simulation noise parameters for the physics experiments, fit to match human predictions in supplemental experiment S3. Lower: other model parameters (the decay parameter γ for JIT, and softmax temperature α for VGC) were fit to maximize correlation with human recall in Experiment 2A. These same parameters were re-used to generate model predictions for experiment 2B.
表S1 上:物理実験に最適なシミュレーションノイズパラメータ。補足実験S3における人間の予測と一致するようにフィッティングされた。下:実験2Aにおいて、人間の再現率との相関を最大化するために、他のモデルパラメータ(JITの減衰パラメータγ、VGCのソフトマックス温度α)がフィッティングされた。これらの同じパラメータは、実験2Bのモデル予測を生成するために再利用された。
We procedurally generate a set of 40 10x10 grid worlds to serve as our evaluation set. Grid worlds were constrained to contain between 5-10 objects and contain at least one object-free path from start to goal. Each object was made up of 3-8 continguous tiles. When comparing JIT and VGC, we used fixed-parameter versions of both models. For JIT, we used αd = 0,αh = 1, turning A⋆ search into a stochastic greedy best-first search, and fixed γ = 0. For VGC, we use the static model variant, and set α = 0.1, mirroring the parameter setting in Ho et al. (2022).
評価セットとして、10x10のグリッドワールド40個を手順的に生成する。グリッドワールドには、5~10個のオブジェクトが含まれ、スタートからゴールまでのオブジェクトフリーパスが少なくとも1つ含まれるように制約した。各オブジェクトは3~8個の連続したタイルで構成された。JITとVGCを比較する際には、両モデルの固定パラメータ版を使用した。JITでは、αd = 0、αh = 1を使用し、A⋆探索を確率的貪欲最良優先探索に変換し、γ = 0に固定した。VGCでは、静的モデルバリアントを使用し、Ho et al. (2022) のパラメータ設定を反映してα = 0.1とした。
Extended data Figure E5 shows a case study of a world with extreme disparity in the amount of objects that JIT and VGC represent. In this world, the maximally valuable construal chooses to represent every object, while JIT only represents only half of the objects on average. This discrepancy can be explained by visual inspection of the optimized policies and plans found by both models. The JIT model samples trajectories that mostly miss peripheral objects on the edges of the maze, resulting in low encoding strength for those objects. Conversely, for VGC, those same objects cause catastrophic failure modes for the optimal construal policy when removed; thus necessitating their inclusion. For example, when removing object 2 from the construal (second column of Extended Fig. E5), plans that begin by moving upwards may become permanently stuck as they repeatedly attempt to move right, directly into the object. These plans have a value of −¥ as they never reach the goal, and thus dramatically deflate the utility of any
construal that does not include object 2.
拡張データ 図E5は、JITとVGCが表現するオブジェクトの量に極端な差がある世界のケーススタディを示しています。この世界では、最大価値の解釈はすべてのオブジェクトを表現することを選択しますが、JITは平均してオブジェクトの半分しか表現しません。この相違は、両モデルによって発見された最適化されたポリシーとプランを視覚的に検査することで説明できます。JITモデルは、迷路の端にある周辺オブジェクトをほとんど見逃す軌跡をサンプリングするため、それらのオブジェクトの符号化強度が低くなります。一方、VGCでは、同じオブジェクトが削除されると、最適な解釈ポリシーに壊滅的な障害モードを引き起こすため、それらを含める必要があります。例えば、オブジェクト2を解釈から削除する場合(拡張図E5の2列目)、上方向への移動から始まるプランは、オブジェクトに直接向かって右方向への移動を繰り返し試みるため、永久にスタックする可能性があります。これらのプランはゴールに到達しないため、-¥の値を持ち、オブジェクト2を含まない解釈の効用を劇的に低下させます。
The value-guided construal model aims to find a construal that maximizes the following value of representation (VOR) objective:
価値誘導型解釈モデルは、次の表現価値 (VOR) 目標を最大化する解釈を見つけることを目的とします。
\[
VOR(c) = U(c) − C(c)
\]
where \(U(c)\) denotes the utility of simulating or planning with the construal, and \(C(c)\) denotes the representational cost of the construal. As in the planning domain, we take the cost of representation to be the size of the construal: \(C(c) = |c|\). The utility of simulation is given by the counterfactual difference (as measured by the 1-Wasserstein distance) between predictions made by noisy simulation under the construal c and ground truth predictions qtrue obtained by noisy simulation with every object included:
ここで、\(U(c)\) は、解釈を用いたシミュレーションまたは計画の効用を表し、\(C(c)\) は、解釈の表現コストを表します。計画領域と同様に、表現コストは解釈のサイズとします:\(C(c) = |c|\)。シミュレーションの効用は、解釈c のもとでノイズを含むシミュレーションによって行われた予測と、すべてのオブジェクトが含まれたノイズを含むシミュレーションによって得られた真の予測 qtrue との間の反事実的差異(1-ワッサースタイン距離で測定)によって与えられます。
\[
U(c) = W_1(q_s,q_{true})
\]
Instead of selecting the maximally valuable construal, we instead follow Ho et al. (2022) and assume decision makers probabilistically choose a construal via the Luce choice rule, with a temperature parameter α:
最も価値のある解釈を選択する代わりに、Ho et al. (2022)に従い、意思決定者が温度パラメータαを用いてLuce選択ルールを介して確率的に解釈を選択すると仮定します。
\[
p(c) \propto e^{VOR(c)/α}
\]
We obtain predictions for each object by marginalizing over \(p(c)\). For simulation, we use the same set of noise parameters fit to supplementary experiment 3 (see Supplementary Table S1, and we fit the softmax temperature \(α\) via grid-search to maximize the Pearson correlation coeficient r to human recall. The best-fitting softmax temperature was
\(α\) = 20.03; results are shown in Fig. S4
各オブジェクトの予測値は、\(p(c)\) を周辺化することで得られる。シミュレーションでは、補足実験3(補足表S1参照)と同じノイズパラメータセットを使用し、グリッドサーチによってソフトマックス温度\(α\)をフィッティングして、ピアソン相関係数rを人間の想起に対して最大化する。最もよく適合するソフトマックス温度は
\(α\) = 20.03であった。結果を図S4に示す。
We also alternatively explored fitting VGC to minimize RMSE instead of maximizing correlation. The best fitting softmax temperature was α = 370.09, and the results are shown in Fig. S5.
また、相関を最大化するのではなく、RMSEを最小化するようにVGCをフィッティングする方法も検討した。最も適合度の高いソフトマックス温度はα = 370.09であり、その結果を図S5に示す。
In experiment 2B, the outcome of the ball is discretized into five uniformly spaced bins \(b_1,...b_5\). This necessitates a change to the utility function of VGC, as the wasserstein distance is only defined on metric spaces and hence does not apply to categorical distributions. Instead, we use the total variation (TV) distance between the distribution of bin counts as our utility, defined as half the summed absolute difference between the probability mass functions of the two distributions:
実験2Bでは、ボールの結果を5つの等間隔のビン \(b_1,...b_5\) に離散化します。ワッサースタイン距離は計量空間上でのみ定義され、カテゴリ分布には適用できないため、VGCの効用関数を変更する必要があります。代わりに、ビンカウントの分布間の総変動 (TV) 距離を効用として使用します。TV 距離は、2つの分布の確率質量関数の絶対差の和の半分として定義されます。
\[
U(c) = TV (q_x,q_{true}) = \frac{1}{2}\sum_{1\leq i\leq 5}|q_x(b_i) − q_{true}(b_i)|
\]
Because the temperature parameter α and construal cost C(c) are scaled relative to the utility function in 2A, we multiply the 2B utility function by a fixed constant, to ensure that the average utility of a construal in 2B is equal to the average utility of a construal in 2A.
温度パラメータαと解釈コストC(c)は2Aの効用関数に比例してスケーリングされるため、2Bの解釈の平均効用が2Aの解釈の平均効用と等しくなるように、2Bの効用関数に固定定数を掛けます。
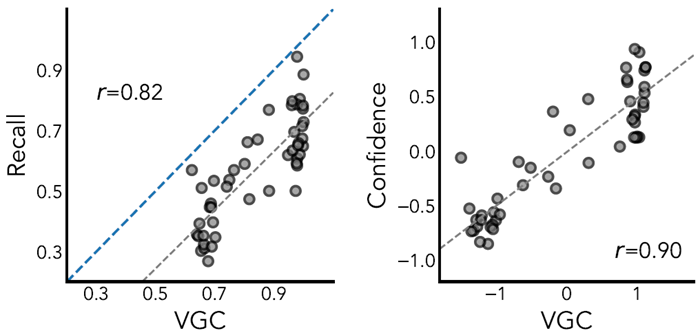
Figure S4 Scatterplots showing predictions from the physics VGC model against Recall (left) and Z-scored Confidence (right) in physics Experiment 2A.
図S4 物理学実験2Aにおける再現率(左)とZスコア信頼度(右)に対する物理学VGCモデルの予測を示す散布図。
For all physics experiments, we used a simple decision rule in which the probability of responding correctly to the memory probe was linearly proportional to the average probability that the object was represented in working memory. Here, we test an alternative based on principles of signal detection theory, but find that the simple decision rule describes participants' behavior better.
すべての物理学実験において、記憶プローブへの正しい反応確率が、物体がワーキングメモリに表象される平均確率に比例するという単純な決定規則を用いた。本研究では、信号検出理論の原理に基づく代替規則を検証したが、この単純な決定規則の方が参加者の行動をより適切に説明できることがわかった。
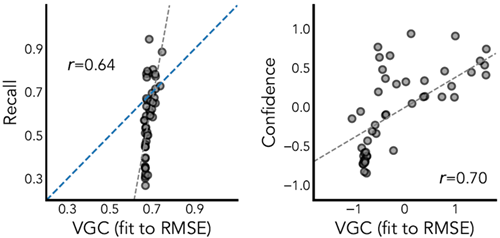
Figure S5 Results from fitting VGC parameters to minimize RMSE instead of maximize correlation. Scatterplots show VGC predictions against human recall (left), and confidence in recall (right).
図S5 相関を最大化するのではなく、RMSEを最小化するようにVGCパラメータをフィッティングした結果。散布図は、人間の想起に対するVGC予測値(左)と想起の信頼度(右)を示しています。
We represent uncertainty due to memory imprecision about an object's position as a 2D gaussian distribution. To formalize how encoding an object affects uncertainty, we place a maximally diffuse prior over object position: p(o) µ 1, and model encoding an object as observing a sample xi from a distribution N(otrue,κ). We assume that participants always observe an unbiased sample of the true object's position: xi = otrue. The updated uncertainty about the true position of the object after encoding an object n times is then given by Bayes' rule:
物体の位置に関する記憶の不正確さに起因する不確実性を2次元ガウス分布で表現する。物体のエンコードが不確実性に与える影響を定式化するために、物体の位置に対して最大拡散事前分布p(o) µ 1を置き、物体のエンコードを分布N(otrue,κ)からサンプルxiを観測するものとしてモデル化する。参加者は常に真の物体の位置の偏りのないサンプルxi = otrueを観測すると仮定する。物体をn回エンコードした後の物体の真の位置に関する更新された不確実性は、ベイズの定理によって与えられる。
\[
p(o|x_1,...x_n) \propto p(x_1,...x_n)p(o) = Normal(o_{true},\overline{κ})
\]
where \(\displaystyle \overline{κ} =\sqrt{\frac{κ^2}{n}}\). At test time, we evaluate the likelihood of each probe object's position \(a,b\) under current beliefs: \(p(a|x_1,...x_n),p(b|x_1,...x_n)\). The probability of choosing a probe is
proportional to the difference in log likelihood:
ここで、\(\displaystyle \overline{κ} =\sqrt{\frac{κ^2}{n}}\)。テスト時に、各プローブオブジェクトの位置\(a,b\)の尤度を現在の信念の下で評価する: \(p(a|x_1,...x_n),p(b|x_1,...x_n)\)。プローブを選択する確率は、対数尤度の差に比例する:
\[
p(choose a|x_1,...x_n) \propto exp(α·(\log p(a|x_1,...x_n) − \log p(b|x_1,...x_n))
\]
Supplemental Figure S6 shows predictions from the signal detection variant of the JIT model on recall from Physics Experiment 2A, after fitting the likelihood variance \(κ\) and the choice temperature α. Despite having one extra free parameter on top of the original JIT model, this signal detection variant results in a worse fit overall (recall: r = 0.83, rmse: 0.22, confidence: r = 0.88).
補足図S6は、物理学実験2Aの再現率におけるJITモデルの信号検出変種による予測値を示しています。尤度分散\(κ\)と選択温度αをフィッティングした後の結果です。元のJITモデルに1つの自由パラメータが追加されているにもかかわらず、この信号検出変種は全体的に適合度が悪くなっています(再現率:r = 0.83、rmse:0.22、信頼度:r = 0.88)。
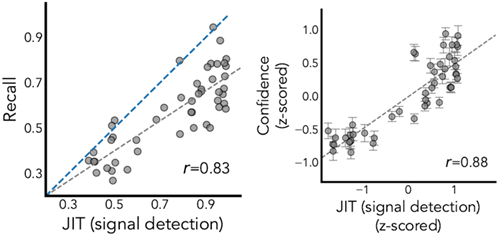
Figure S6 Scatterplots showing predictions from the physics VGC model against Recall (left) and Confidence (right) in physics Experiment 2A.
図S6 物理学実験2Aにおける再現率(左)と信頼度(右)に対する物理学VGCモデルの予測を示す散布図。
We tested an additional baseline that predicted performance on memory probes not as reflecting effects of object representations in working memory, but rather as a counterfactual judgment. More specifically, our reconstructive baseline hypothesizes that people remember the predictions they made during the task, formalized as a set of reference predictions qref, and resimulate during the memory probe to identify the object that produced simulations more closely resembling the predictions they remember. For each probe object a,b, the model generates candidate solutions qa,qb assuming object a was the real object, and vice versa. The probability of a choice is directly proportional to the difference between the counterfactual simulations and the reference simulation, measured using the one dimensional wasserstein distance. We normalize wasserstein distances as
compared to a completely random prediction quniform:
我々は、記憶プローブにおけるパフォーマンスを、作業記憶における物体表現の影響を反映するものではなく、むしろ反事実的判断として予測する追加のベースラインをテストした。より具体的には、我々の再構成ベースラインは、人々がタスク中に行った予測を記憶し、参照予測qrefのセットとして形式化し、記憶プローブ中に再シミュレーションを行い、記憶している予測により近いシミュレーションを生成した物体を特定するという仮説を立てる。各プローブ物体a、bについて、モデルは物体aが実際の物体であると仮定して候補解qa、qbを生成する。逆もまた同様である。選択の確率は、1次元ワッサースタイン距離を用いて測定された反事実的シミュレーションと参照シミュレーションの差に正比例する。ワッサースタイン距離は、完全にランダムな予測quniformと比較して正規化する。
\[
p(a) \propto \exp\left(−α^{−1}·\frac{W_1(q_a,q_{ref})}{W_1(q_{uniform}, q_{ref})}\right)
\]
We fit the softmax temperature α using grid-search. This baseline performs worse than the JIT model, with (r = 0.58,RMSE = 0.27) for recall, and (r = 0.63) for confidence; see Supplemental Figure S7 for more details.
グリッドサーチを用いてソフトマックス温度αをフィッティングしました。このベースラインはJITモデルよりもパフォーマンスが低く、再現率は(r = 0.58, RMSE = 0.27)、信頼度は(r = 0.63)でした。詳細は補足図S7を参照してください。
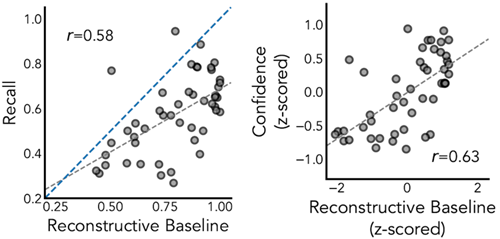
Figure S7 Scatterplots showing the reconstructive baseline's predictions against Recall (left) and Confidence (right) in physics Experiment 2A.
図S7 物理学実験2Aにおける再現率(左)と信頼度(右)に対する再構成ベースラインの予測を示す散布図。
Finally, we performed several additional analyses to see how much our results were driven by low-level features of the stimuli we used.
最後に、使用した刺激の低レベルの特徴によって結果がどの程度左右されるかを確認するために、いくつかの追加分析を実行しました。
We analyzed recall performance as a function of: (1) the total number of objects in the world (Supplemental Fig. S8), (2) proximity of the target object to nearby objects (Supplemental Fig. S9), (3) how much the lure stimuli were shifted (Supplemental
Fig. S10), and (4) the amount of variance in simulated trajectories, measured as the standard deviation of x positions at the midpoint of trajectories (Supplemental Fig. S11. The size of the world, the magnitude of the shift, and midpath variance were completely uncorrelated to recall (r = −0.06,0.09,−0.01) respectively. The proximity to the nearest neighbor showed more explanatory power (r = −0.33), but semi-partial correlations showed it only explained marginally more variance after accounting for the JIT predictions
(\(r_{x,y}\) = −0.12).
想起パフォーマンスを以下の関数として分析しました。(1) 世界に存在するオブジェクトの総数 (補足図 S8)、(2) ターゲットオブジェクトと近傍オブジェクトとの距離 (補足図 S9)、(3) ルアー刺激の移動量 (補足図 S10)、(4) シミュレーションされた軌道の分散量 (軌道の中間点における x 位置の標準偏差として測定) (補足図 S11)。世界の大きさ、移動量、中間経路の分散は、想起と完全に無相関でした (それぞれ r = −0.06、0.09、−0.01)。最近傍オブジェクトとの距離はより高い説明力を示しました (r = −0.33)。しかし、半偏相関では、JIT 予測を考慮した後でも、それがわずかに多くの分散を説明するだけであることが示されました (\(r_{x,y}\) = −0.12)。
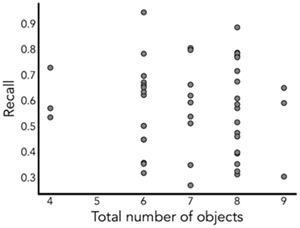
Figure S8 Scatterplots showing correlation between the total world size (measured as the number of objects in the world) on object recall, in physics Experiment 2A.
図S8 物理学実験2Aにおける、世界全体のサイズ(世界にある物体の数として測定)と物体想起との相関関係を示す散布図。
We fit the parameters of the JIT model to each of the 9 experiments from (Ho et al., 2022), including the three experiments shown in the main text. The full set of
results for all 9 experiments are shown in Extended Data Figure E4. In all experiments, the JIT model was better correlated with human performance than VGC.
本文中に示した3つの実験を含む、Ho et al., 2022の9つの実験それぞれにJITモデルのパラメータを当てはめました。9つの実験すべての結果セットは、拡張データ図E4に示されています。すべての実験において、JITモデルはVGCよりも人間のパフォーマンスとの相関が良好でした。
Fitted parameter values are shown in table S2. Note that for the hover experiments, γ was fixed to be 0. Likelihood plots for the three main text experiments are shown in S12, demonstrating that JIT outperformed VGC across all grids in all three experiments.
適合パラメータ値は表S2に示されている。ホバー実験ではγが0に固定されている点に注意されたい。3つの主要なテキスト実験の尤度プロットはS12に示されており、3つの実験全てにおいて、全てのグリッドにおいてJITがVGCを上回ったことが分かる。
\[
\begin{array}{l l l l}
\hline
\text{実験} & α_d & α_h & γ \\
\hline
\text{initial awareness} & 0.00 & 0.05 & 1.34 \\
\text{upfront awareness} & 0.21 & -0.47 & 1.42 \\
\text{critical memory} & 0.00 & -0.21 & 1.11 \\
\text{critical confidence} & 0.21 & -0.21 & 1.42 \\
\text{critical awareness} & 4.00 & 3.74 & 0.79 \\
\text{initial hover} & 0.21 & -0.47 & 0.00 \\
\text{initial loghover duration} & 0.21 & -1.00 & 0.55 \\
\text{critical hover} & 3.37 & 1.37 & 0.00 \\
\text{critical loghover duration} & 0.00 & -0.47 & 0.24 \\
\hline
\end{array}
\]
Table S2 Best fitting model parameters for each experiment in (Ho et al., 2022)
表S2 各実験における最適なモデルパラメータ(Ho et al., 2022)
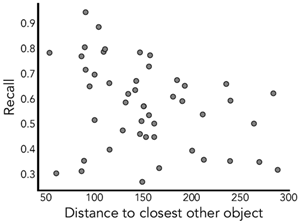
Figure S9 Scatterplots showing correlation between the distance to nearest neighbor on object recall, in physics Experiment 2A.
図S9 物理学実験2Aにおける物体想起と最も近い物体までの距離との相関関係を示す散布図。
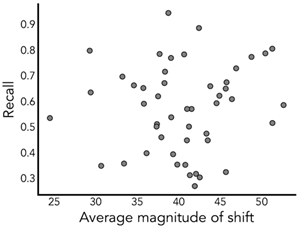
Figure S10 Scatterplots showing correlation between the average distance between target and lure stimuli on object recall, in physics Experiment 2A.
図S10 物理学実験2Aにおける物体想起時のターゲット刺激とルアー刺激間の平均距離の相関関係を示す散布図。
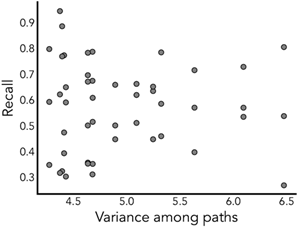
Figure S11 Scatterplots showing correlation between the variance of ball trajectories on object recall, in physics Experiment 2A.
図S11 物理学実験2Aにおけるボールの軌道の分散と物体想起との相関関係を示す散布図。
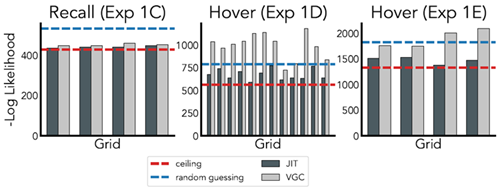
Figure S12 Bar plots showing per-grid likelihoods for the three experiments in the main text. The JIT model consistently predicts human behavior than VGC across all trials in all experiments.
図S12 本文中の3つの実験におけるグリッドごとの尤度を示す棒グラフ。JITモデルは、全ての実験の全試行において、VGCよりも一貫して人間の行動を予測する。